Software product managers and developers typically treat analytics as a standalone capability—something to be integrated into their application’s dashboard or reporting module. As a product feature, analytics is undoubtedly a valuable tool. But offering it merely as a tacked-on function is an approach that lags behind where your users are today.
When data analytics is limited to dashboards, users must switch away from their transactional environment whenever they need to interrogate data or derive insight. This disrupts workflows and interrupts trains of thought, creating friction for the user. Moreover, a standalone analytics capability doesn’t provide context or guided analysis. Users must look for anomalies or trends manually. As a result they’re less likely to dive into analytics to support good business decision making.
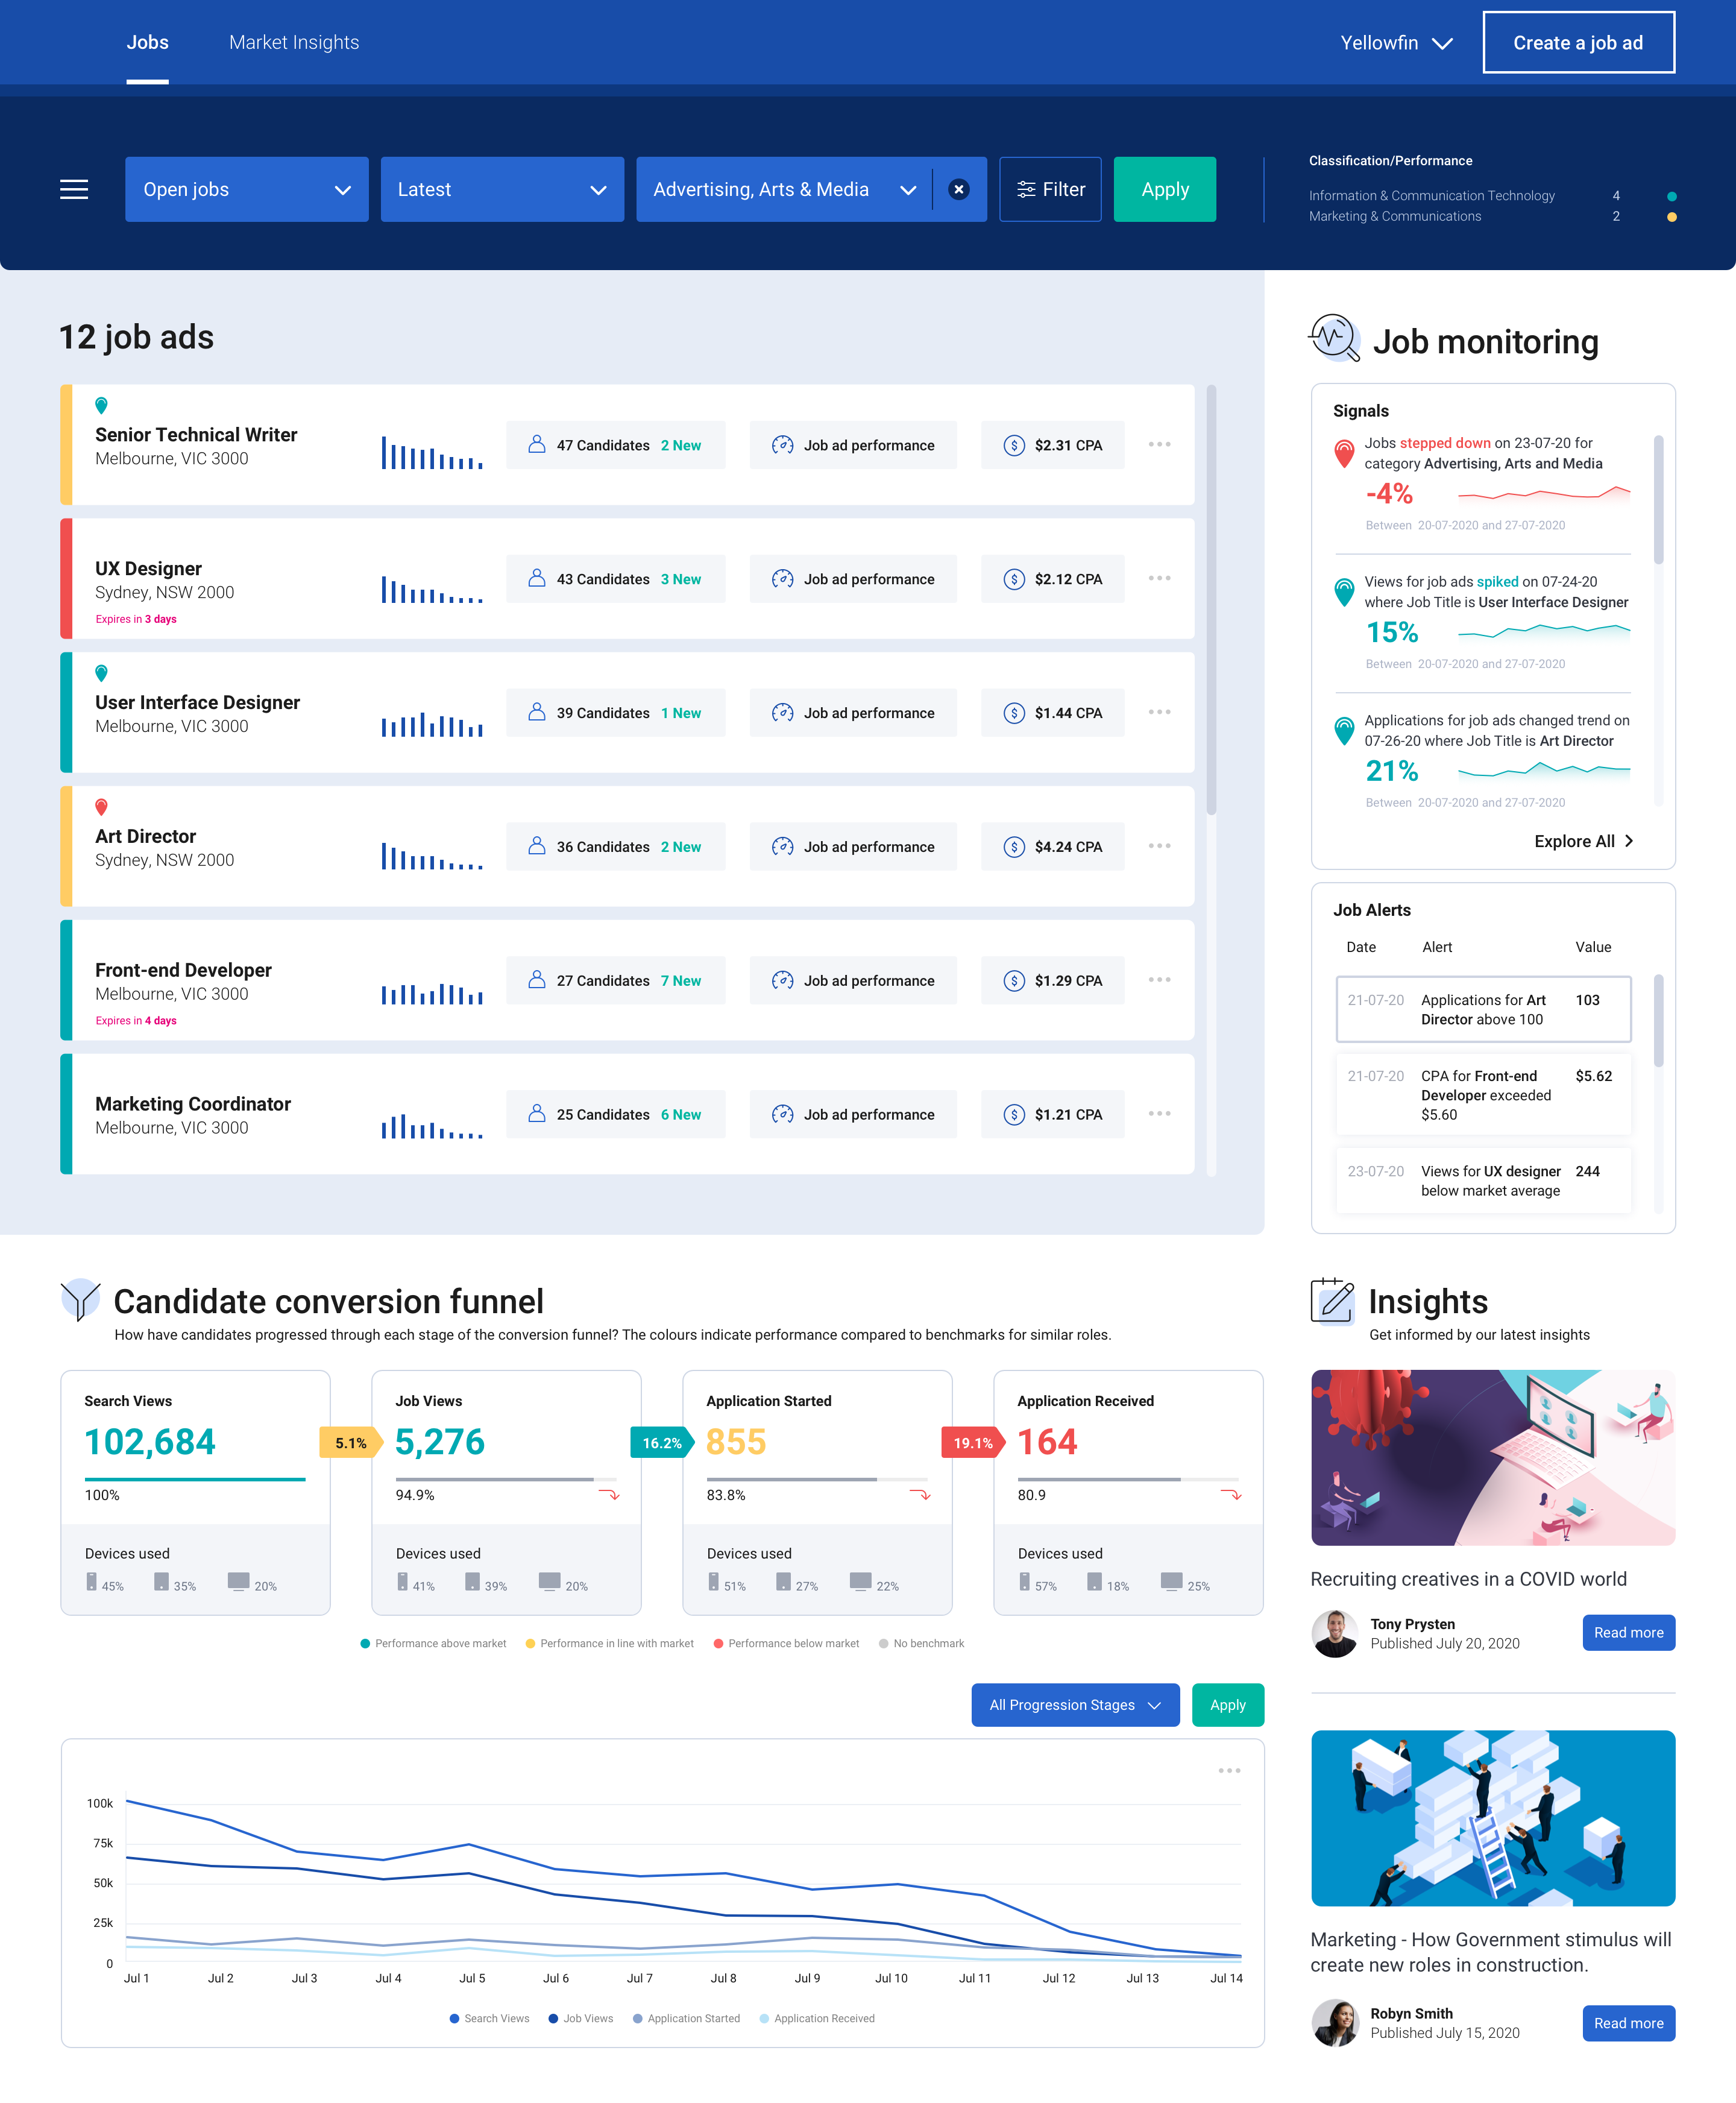
Contextual analytics, on the other hand, gives users a powerful tool right at the point of their daily work. Contextual analytics is defined as any analytics solution that is integrated directly into an application’s core workflows. This approach delivers the benefits of analytics in the situational framework where decisions must be made.
Embedding analytics in this fashion creates significant value for the user. Charts, tables and metrics sit side-by-side on the screen, alongside the application’s central functions. With one click, the user gains instant, guided and dynamic insight.
Such an improvement is helpful for all kinds of business activity. Retail store managers can instantly access demand forecasts while creating weekly work schedules. Inventory managers can view trends and analyze stock without leaving their ordering screen. Supply chain, finance, logistics, sales and marketing, manufacturing—any process involving routine data processing can profit from contextual analytics.


A Rich Workflow Asset
When embedded into transactional workflows, contextual analytics can deliver two forms of understanding. The first comes from predefined visualizations, ranging from simple KPI numbers to line and bar charts and even contextual dashboards. These visualizations are presented based on user action; a customer’s purchase history, for example, can pop up in chart format while viewing the account record, enabling the user to make decisions about sales incentives or priorities for service.
Second are dynamic analyses and alerts. These indicate that either thresholds have been crossed or anomalies in a record have been discovered, prompting the user to explore and take further action. Pop-up alerts can be invaluable in sales, production, finance or many other disciplines.
For both predefined and dynamic contextual analytics, outcomes can be based on simple aggregations of transactional data or as the result of sophisticated data science modeling (e.g., propensity to purchase). Specific outcomes can be set by either the product manager or the user to maximize utility.
Contextual analysis is ideal for supporting or triggering actions according to any business need. The capability enhances transactional workflows by providing metrics pertaining to a particular transaction; it will also trigger a new workflow via an alert or suggestion for action, based on the output of a data science model.
Of course, none of this means that dashboard-based analytics aren’t still important. Users will always need to conduct broad data analysis. Dashboards and/or report analytics allow users to monitor overall business performance, drilling down when necessary into the details behind the numbers.
With the secondary addition of contextual analytics, however, users can be continually guided in their decision making as they work. They receive a constant flow of deeper insight, supporting management tasks intuitively at a granular level.
Deployment Framework for Developers
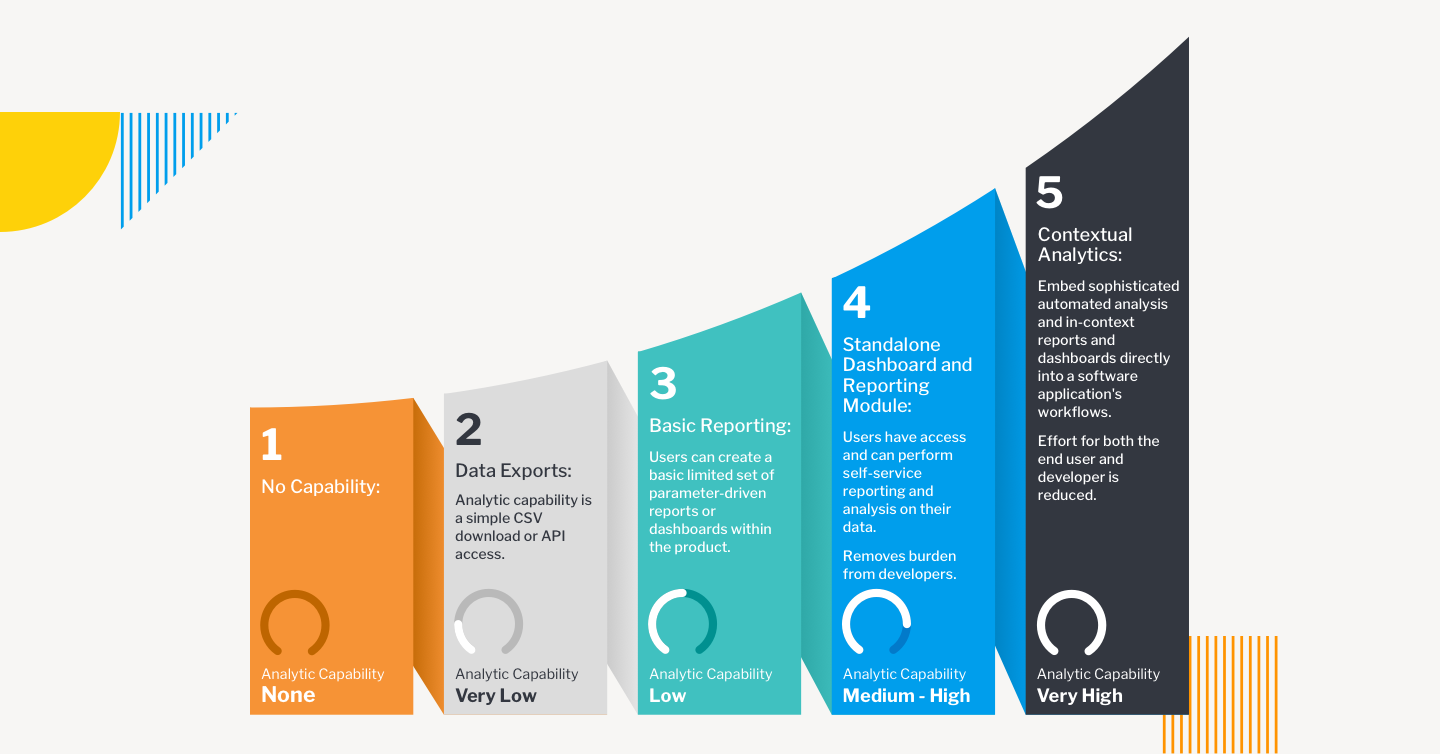
Embedding transactional analytics into enterprise applications can be directed according to a maturity model. There are five possible stages of product development:
- Stage One: No Capability. The main engineering focus is on bringing a new application to market. Minimal Viable Product (MVP) attributes lead development, and reporting capabilities are rarely included.
- Stage Two: Data Exports. Analytics are provided based on customer feedback, but only through a CSV download or API access that allows the end user to analyze data in their preferred tool. The burden of building analyses rests with the customer.
- Stage Three: Basic Reporting. A limited set of reports are supported by analytics, and in-house developers are tasked with creating the capability, often to the detriment of new features for the core product.
- Stage Four: Standalone Dashboard and Reporting Module. This is often the end journey for most enterprise applications. Self-service reporting and analysis are available via out-of-the-box dashboards and reports.
- Stage Five: Contextual Analytics. Sophisticated, automated analysis is available as part of the application’s core workflows, as well as at the dashboard. Users are guided to optimal decision-making at both the transactional and reporting level.
These stages are not mutually exclusive. Especially for stages four and five they can be additive, so that end users will have a variety of mechanisms to access the data they need, at the time they need it.
Accelerating Implementation
Elevating the end user analytics experience is easier to achieve than it once was, thanks to BI vendors that specialize in embedded and contextual analytics built on an open platform. The best vendors are able to adapt quickly and easily to product development roadmaps, aligning features to meet specific needs and following up with administrative tools and automation processed to support the lowest possible cost of ownership.
Working with an analytics vendor means development teams will have maximum support from prototype and design to integration, deployment and subsequent iteration. Options for Windows and Linux, on-premises or cloud will ensure the versatility, security and scalability required for highly marketable offerings.
How Customers View Analytics
As a product feature, analytics can often be dismissed as an afterthought—but your users don’t see it that way. BI analytics is increasingly seen as critical to business governance. Users want to glean as much insight as possible from the data they’re collecting—and on multiple levels. This means your users want to get more from your product, even in ways they haven’t yet imagined. Contextual analytics can provide that enhanced appeal for your application, putting your product out in front at a time when enterprise applications are more essential—and more competitive—than ever before.