By Eshan Wickrema and Lachlan James
So it all comes down to this: After the desperately underwhelming performance of England as host, two of rugby’s powerhouse nations, Australia and New Zealand, stand toe-to-toe in the decider – the Final of Rugby World Cup 2015.
But, it’s not all doom, gloom and despair for England. Using data visualization and Business Intelligence software to assess past performances and current form, a comfortable New Zealand victory seems probable – if not inevitable. So, at the very least, Englishmen everywhere can be comforted by the fact that they can most likely laud the 2015 Ashes outcome over Australia for a little longer.
Points accumulation and breakdown at RWC 2015: Australia vs New Zealand
Insights
- New Zealand has scored 51 more tournament points than Australia (256 vs 205)
- Australia’s 205 points are made-up of:
- 26 tries (130 points), of which they have converted 15 (30 points) – a conversion rate of 58%
- 15 penalty kicks (45 points)
- Australia have not kicked a drop goal
- New Zealand’s 256 points are made up of:
- 36 tries (180 points), of which they have converted 26 (52 points) – a conversion rate of 72%
- 7 penalty kicks (21 points)
- 1 drop goal (3 points)
- Australia’s 205 points are made-up of:
The All Black try-scoring machine
Both Australia and New Zealand have played and won six games to make it to the 2015 RWC Final. But, it’s the manner in which they’ve achieved their respective victories that highlights the gulf in class.
The All Blacks have scored 256 tournament points for an average of 43 points per game, while Australia’s 205 points at RWC 2015 give it an average of 34 point per match. Not only is the nine (8.5) points differential per game significant, it’s also clear that Australia have had to rely more on penalty kicks to overcome their opponents. New Zealand has dived over the line on 36 occasions, compared to the Wallabies 26 tries. With 50 more points scored through tries, in conjunction with the fact that tries make-up a larger percentage of their already superior points tally (70.3% vs 63.4%), New Zealand look set to muscle their way past Australia.
And, even if it comes down to kicks, New Zealand has its radar working nicely, converting 72% of its tries compared to Australia’s 58% conversion rate.
What’s more, an analysis of the ruthlessness of New Zealand’s general play, compared to Australia’s, underscores just why they’ve been able to score more heavily and manufacture more tries.
Statistics from general play at RWC 2015: Australia vs New Zealand
Insights
- New Zealand has gained 1085 more metres than Australia with ball in hand (3464 vs 2379). This could be a combination of the All Blacks’ 53 ‘offloads’ and 61 ‘clean breaks’ compared to Australia’s 35 offloads and 46 clean breaks.
- New Zealand has also had more ‘carries’ (756 vs 590) and ‘carries over gain line’ (325 vs 253) than Australia.
- Both teams have a similar number of ‘lineout wins’ (73 to Australia, 70 to New Zealand), but the All Blacks have made more ‘lineout steals’ (14 vs 8).
- Australia has completed significantly more tackles than New Zealand (726 vs 551) – 32% more in fact, which suggests the Wallabies have had to spend more time and energy defending compared to the All Blacks.
All Blacks hold the attacking edge
New Zealand’s scoreboard preeminence is also reflected in statistics from key areas of general play. The All Blacks’ attacking flair is highlighted by the 1085 additional meters gained, compared to Australia, over the duration of their six games. This superiority is evidenced by New Zealand’s additional 18 offloads, 15 clean breaks, 166 carries, 72 carries over gain line and six lineout steals compared to the Wallabies.
In fact, the only stat that Australia wins convincingly is the tackle count (726 vs 551), which indicates that the Wallabies have had to defend much more often than New Zealand.
With the tournament form guide clearly going the way of New Zealand, do the matches directly leading up to RWC 2015 offer Australia any hope?
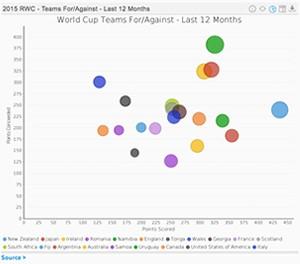
Win rate and points differential over the past 12 months: New Zealand vs Australia
Insights
-
- Australia has won 73.33% of its international matches over the last 12 months
- New Zealand has won 93.33% of its international matches over the past 12 months
- Australia has won 73.33% of its international matches over the last 12 months
Insights
- New Zealand has scored more points than Australia in the last 12 months – 563 compared to Australia’s 449
- New Zealand has conceded fewer points compared to Australia (233 vs 292)
- New Zealand has a vastly superior points differential compared to Australia (330 vs 157)
Both Australia and New Zealand have a positive points differential over the past 12 months of international competition. But, that’s where the similarities end. New Zealand has scored far more, and conceded far fewer, points than Australia. The All Blacks have a positive points differential of 330 compared to the Wallabies 157.
However, if there’s the faintest glimmer of hope for the Aussies, it’s this: New Zealand’s sole loss in the 12 months leading into RWC 2015 came at the hands of the Wallabies. But, given the All Blacks’ current form – and winning percentage coming into the tournament (93.33% compared to Australia’s 73.33%), that seems a pretty long bow.
Australia vs New Zealand: All-time head-to-head record
With two RWC titles apiece, history says that both Australia and New Zealand know how to get the job done on rugby’s biggest stage.
However, the Kiwi’s have made it to the Semi Final stage on seven occasions, compared to Australia’s six. Regardless, these performances came against a variety of opposition. So what tale does the head-to-head record tell?
In the last 12 months, Australia and New Zealand have played each other twice, with one win apiece. Additionally, Australia and New Zealand share the honours for games played against each other on neutral grounds. Furthermore, in matches played at the world cup, Australia has claimed two of the three meetings between the two sides.
However, looking at the same time span (1987 – present), New Zealand has been more successful in all international matches played against Australia, beating the Wallabies 68.75% of the time.
Additionally, the head-to-head record for all matches ever played between these two nations also paints a pretty definitive picture, with New Zealand emerging victorious 68.18% of the time.
So, while Australia’s grit, and knack for performing on the big stage, might make for a competitive 2015 RWC Final, the data analysis suggests that the attacking prowess of the All Blacks will be too much for the men in green and gold.
Enjoy your consolation prize, England fans.
We recommend
Data visualization assesses Halloween 2015: Who gets and gives the candy? >

Data visualization (and hilarious memes) presents: Rugby vs football in the UK >

Data visualization: Oktoberfest by the numbers >

Data visualization assesses 2015 Rugby World Cup >

Data visualization: Why you don’t need to feel bad about Serena Williams’2015 US Open exit >

Data visualization: Have the world’s happiest countries changed over time? >

Data visualization uncovers world’s happiest countries >

Cricket: Data Visualization predicts 2015 Ashes outcome >

Data analysis predicts 2015 Wimbledon men’s champion >

Data Viz reveals why Game of Thrones season 5 most popular >

Data Visualization: Game of Thrones seasons 5 most divisive >

Data visualization shows most popular Game of Thrones Season >