
Blog Contents
show
Introduction - Why "Live Data" Is Now a Leadership Requirement
Decisions are only as good as the freshness of the data behind them
Slow data creates slow action. That is the real problem. A report delivered on a weekly cadence can miss a sales dip, a churn spike, or a supply issue that started yesterday. By the time the team sees it, the cost is already there. Corporate leadership and “The C-Suite” cares about revenue protection, customer experience, efficiency, and speed to decision. Those goals depend on live data, not stale snapshots. When teams see what is happening now, they can respond with less guesswork and more control.What this article will cover
We look at how Yellowfin 9.17 supports faster business decisions with AI-powered BI, live data dashboards, embedded analytics, data storytelling, and automated signals. We also point to practical next steps, like the latest AI-powered features in Yellowfin 9.17, the Power BI Alternative: Yellowfin Migration Guide, and the AI chatbot assistants, Ask Yellowfin and Code Assistant.Why Traditional BI Slows Down Decision-Making
Static reports create latency between insight and action
Traditional BI still leans frequently on weekly reports, with time-consuming manual exports, plus analyst queues waiting for specialist help in extracting and collating into something usable. That works for basic tracking, but it does not fit fast-moving teams. Business users want answers during a meeting, not in next week's presentation. That gap between demand and delivery creates delay. The question lands, the analyst builds the view, the report is shared, and the moment has passed. The workflow is the problem."Good enough" reporting often hides real business costs. Leaders lose clear oversight. Teams stop working from the same numbers. Performance issues stay buried until they become expensive. This is why data-driven decision-making gets so much attention. The widely-respected McKinsey & Company has written often about the value of data-driven organizations and the operating gains that come from faster, better use of data. See McKinsey's research on data and digital transformation. The message is simple. If data arrives late, decisions do too. A failure to perform breeds further failures.
What Makes Yellowfin Different for Modern Analytics Teams
AI, automation, and collaboration in one platform
Yellowfin BI AI analytics brings natural language query, assisted insights, signals, and stories into one place. That matters because teams do not need another dashboard tool. They need a way to ask, explain, share, and act in one flow. Ask a question in plain language. Get a concise, impactful chart. Review a succinct and right-on-the-mark AI-assisted explanation. Share the result with the team. That cuts friction and enhances delivery of the business facts and supporting evidence across the whole analytics process.Built for both technical and non-technical stakeholders
Yellowfin fits different roles without forcing them into the same workflow:- Data analysts spend less time on repetitive reporting
- Business analysts get faster exploration and cleaner explanations
- Executives get decision-ready summaries with live data context
Yellowfin 9.17 and the Rise of Conversational Analytics
Ask questions in plain language with Yellowfin’s AI NLQ
“Ask Yellowfin” lets users query data in plain English, with no SQL required. A user can ask, "What happened to revenue last quarter?" and get charts and graphs right away. You speak like a human, not like an extension of a complex computer querying program. The useful part is context retention. Follow-up questions build on the last one. That means users can keep asking, narrow the view, and test a hypothesis without starting over. It feels closer to a conversation than a tedious back-and-forth ticketing queue.Move from question to chart to action faster
Conversational analytics shortens the path from curiosity to answer. That is a real gain for teams that need quick checks during planning, trading, customer reviews, or operations meetings. The world-renowned Gartner has tracked the rise of augmented analytics and natural language interaction in BI. See Gartner's overview of augmented analytics. The trend is clear. Users want direct access to data, not another layer between them and the answer.From Dashboards to Decisions: How Assisted Insights and Signals Reduce Blind Spots
Charts show the what. They do not always show the why. That is where Yellowfin's awesome "Tell Me About My Data" comes in. It writes clear, context-aware explanations around the chart for you, so users can understand the trend without guessing. That matters in live data dashboards. A spike may look good until the reason behind it is clear. A dip may look small until the supporting detail shows risk. Good quality AI-written context helps teams read data faster.Signals catch what humans may miss
Yellowfin Signals watches for threshold breaches and AI-driven anomalies. That is useful when no one has time to scan every chart, every day. They go far beyond simple alerts, providing intelligent attention-grabbing.. signals.. that something is happening, and you should know about it. Use cases include:- Revenue drops
- Churn risk
- Inventory issues
- Sales pipeline slippage
- Operational bottlenecks
| Capability | Manual Reporting | Yellowfin Signals |
| Detection speed | Delayed | Real-time or near real-time |
| Analyst effort | High | Automated |
| Risk visibility | Reactive | Proactive |
| Business impact | Missed issues | Faster intervention |
Why Storytelling Still Matters in a Data-Driven Organization
A chart can inform. A data story can align a team and make the details of the facts clear. Yellowfin Stories lets users package charts, notes, and context into a single narrative. That makes it easier to explain the business issue, the evidence, and the next step. They are your ever-ready intelligent automated blog creator, your newsletter writer, your always-willing report assistant, compiling the right things for you in a matter of seconds. Executives rarely want raw detail first. They want the readout, then the trail behind it. Data stories give them both.Collaborative analytics improves adoption across teams
People trust what they can discuss. It’s not a discussion if everything is one-sided. Yellowfin supports comments, sharing, and interactive presentations, so teams can build a collective agreed view of the data. That also helps retention and comprehension. The Nielsen Norman Group notes that stories improve understanding and memory in data communication. The lesson is practical. If people can discuss the insight, they are more likely to use it.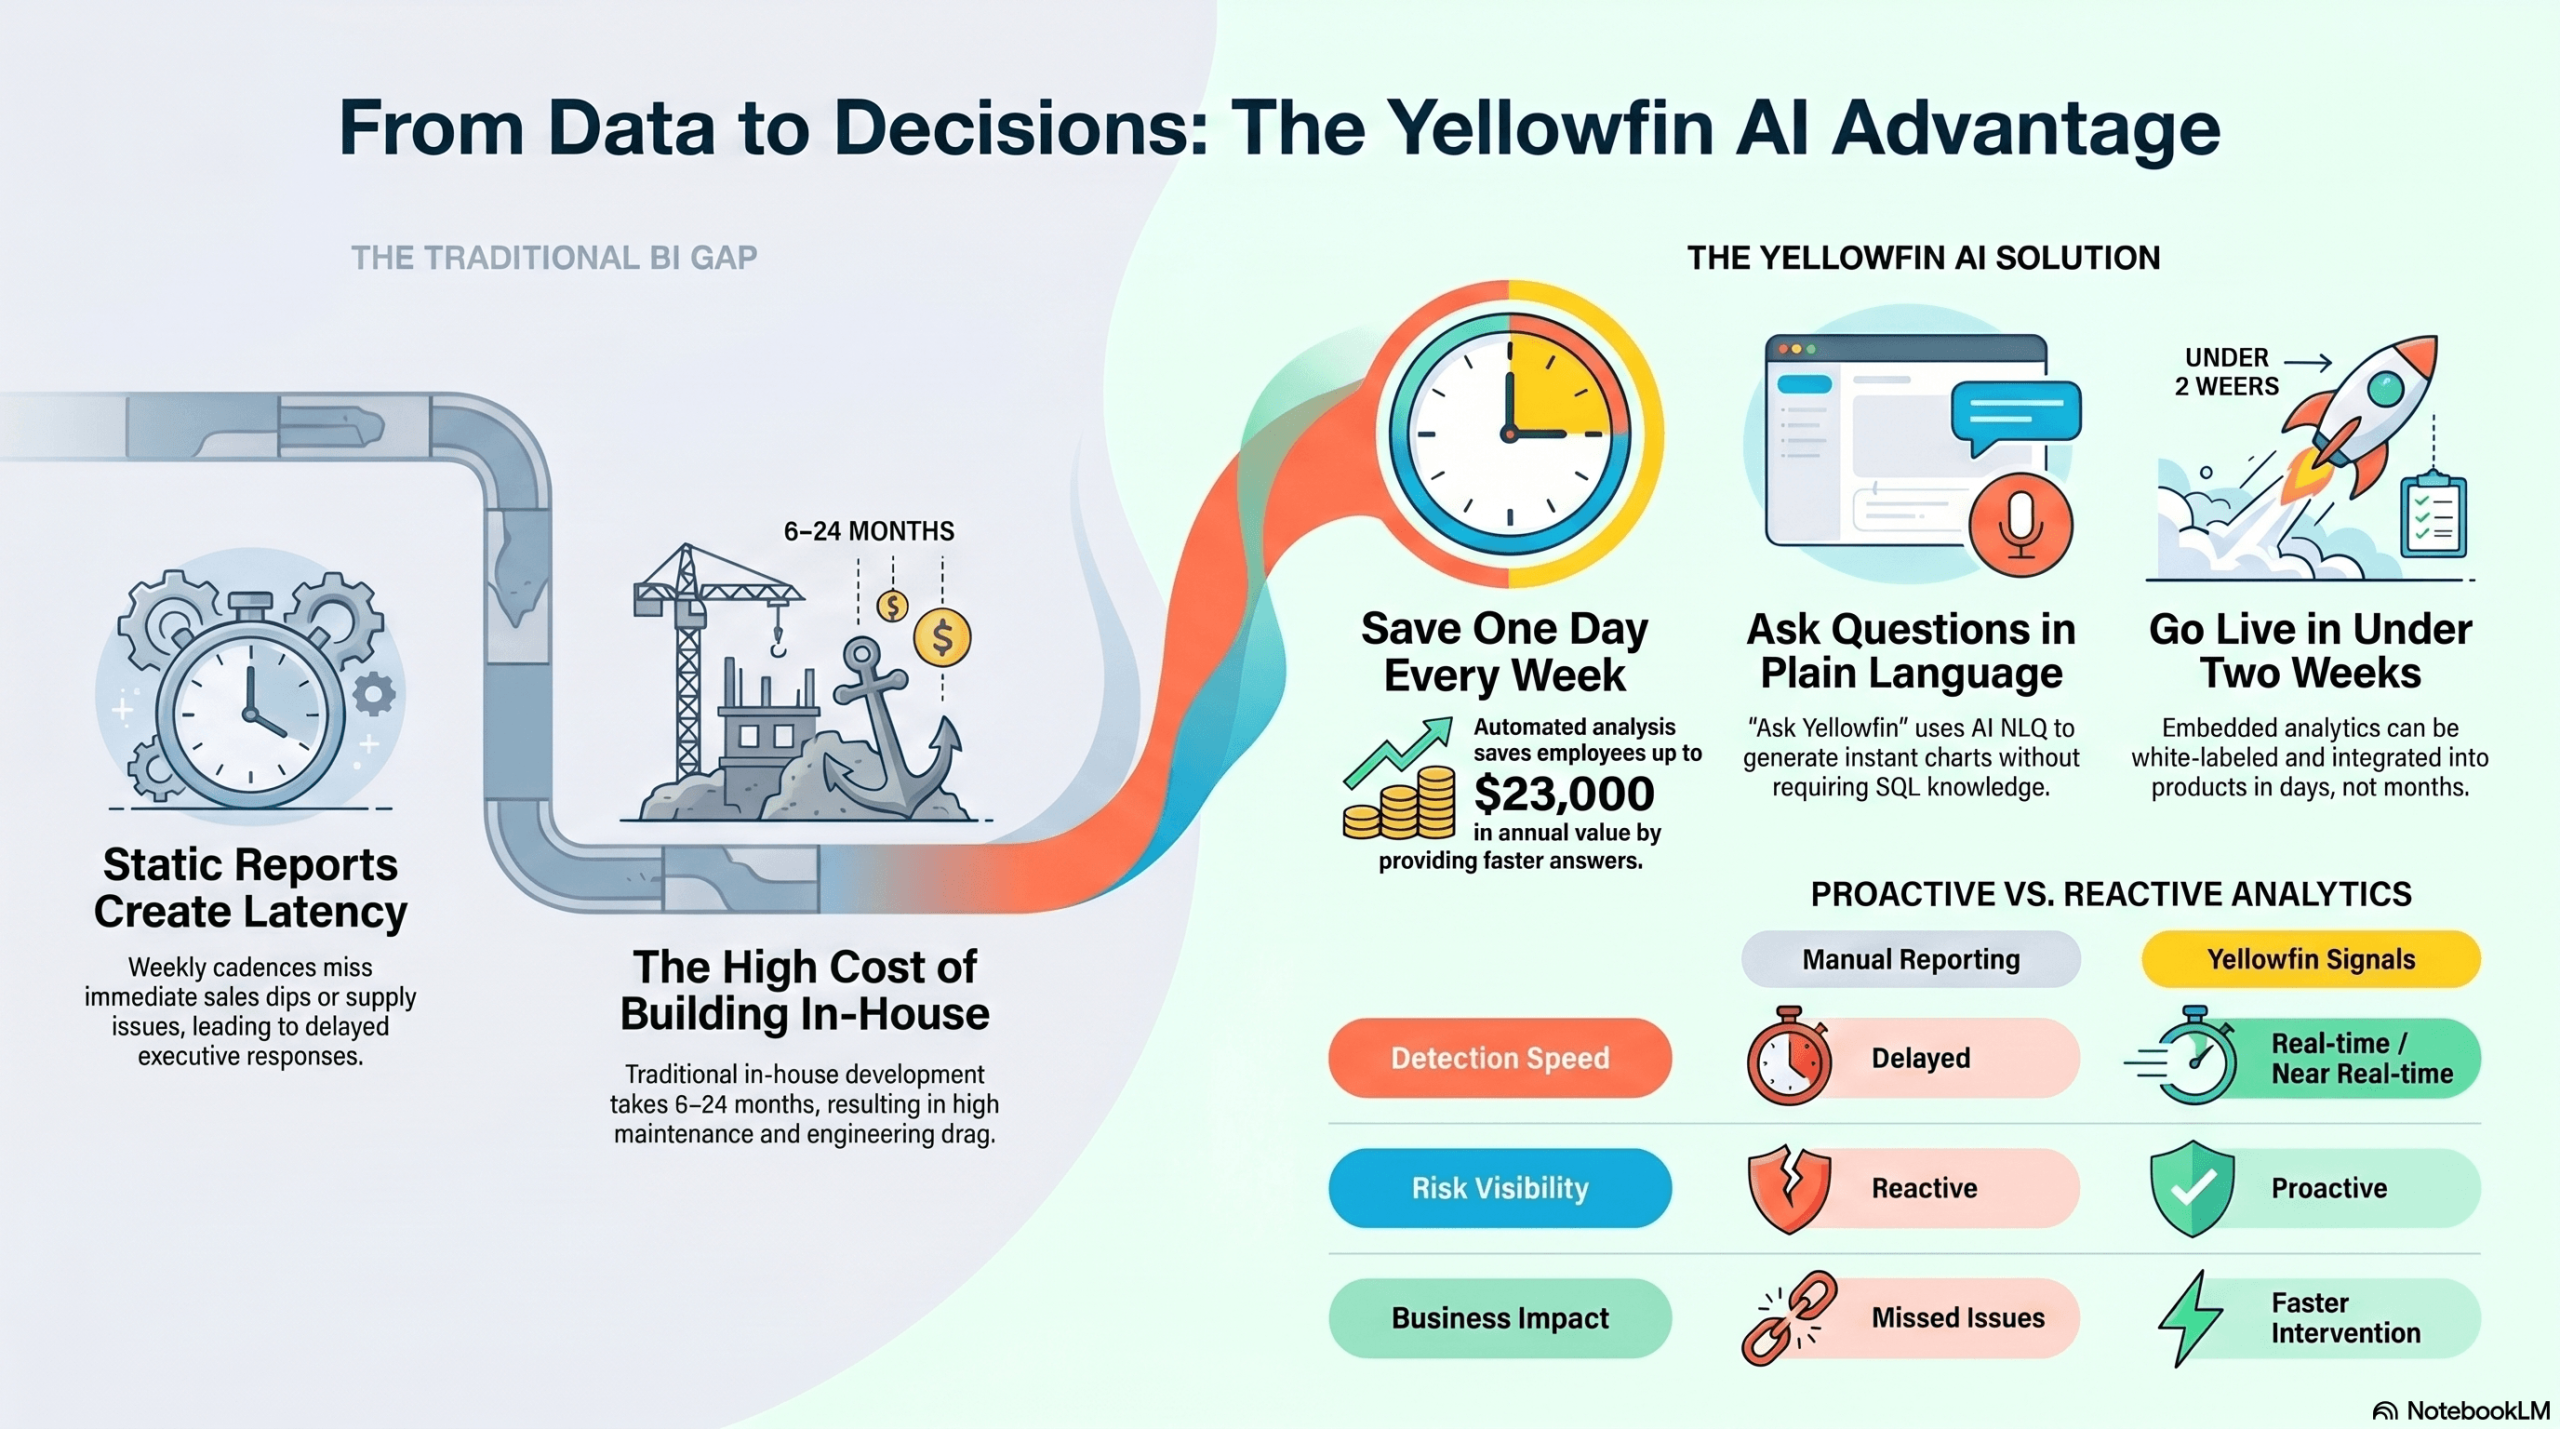
Embedded Analytics: A Competitive Advantage for Product Teams and Customer-Facing Platforms
For product leaders, embedded analytics is not a nice extra. It is part of the product experience. Yellowfin supports white-labeled, native-feeling analytics that sit inside your app instead of pointing users to a separate BI tool. You can truly make Yellowfin look and feel like you created it yourself and it is an integral part of your system . If you’re a system integrator it’s the ultimate minimal effort, maximum perceived value offering. That adaptability changes adoption. Users stay in the flow. Customer-facing analytics feels like part of the product rather than something shoe-horned in and forced to fit. That supports retention and can open new revenue paths.Faster time to market with lower build cost
Building BI in-house often takes months, sometimes far longer. Yellowfin cuts that path down. In many cases, teams go live in under two weeks.| Factor | Build In-House | Yellowfin Embedded Analytics |
| Time to launch | 6-24 months | Days to weeks |
| Maintenance | High | Lower |
| White-labeling | Custom development | Built-in |
| Scalability | Costly | Designed for scale |
| User adoption | Uncertain | Faster due to native UX |
How Yellowfin Supports Different Decision-Makers
Yellowfin reduces repetitive report building and shortens the time spent answering the same questions. Analysts get more room for deeper work. They also have clearer ways to explain findings to stakeholders.For C-level executives and operational leaders
Executives need live evidence, not stale assumptions. Yellowfin gives them current performance views, alerting, and clear data stories that support faster calls. That builds strategic confidence. The team sees the same picture. Decisions come from current data, not old slides.Practical Use Cases: Where Yellowfin Delivers Immediate Business Value
Yellowfin fits common business problems fast:- Revenue performance monitoring
- Customer churn and retention analysis
- Operations and supply chain alerts
- Sales and pipeline visibility
- HR and workforce planning