
By Eshan Wickrema and Lachlan James
Football fans across Europe, and indeed the world, saw Barcelona romp to a 3 – 1 win over Juventus in the final of the 2015 UEFA Champions League. But, what many probably didn’t realize, was that the match was a foregone conclusion – even before kick-off.
Let’s use Business Intelligence software and data visualization to show you why.
Barcelona and Juventus by category: Champions League 2015
Insights
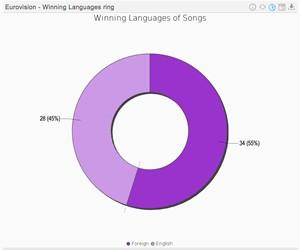
 Data visualization exposes success by language at Eurovision >
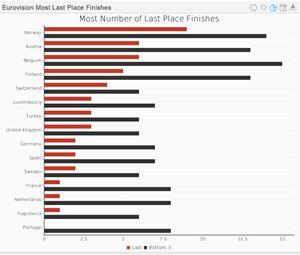
 Data visualization uncovers worst Eurovision performers >
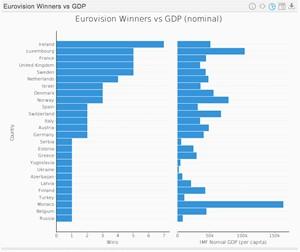
 Data visualization probes Eurovision wins by populace & GDP >
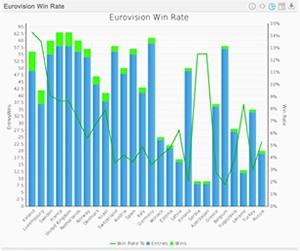
 Data visualization shows Eurovision success rates by country >
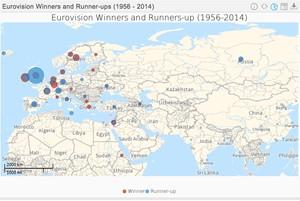
 Data visualization compares Eurovision winners & runners-up >
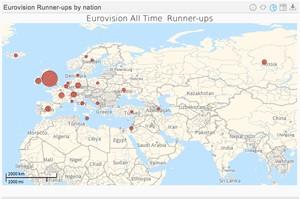
 Data visualization reveals most unlucky Eurovision nations >
 Data Visualization reveals advantage of hosting Eurovision >
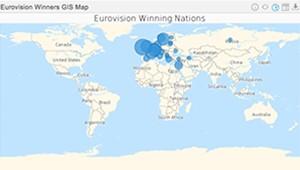
 Data visualization shows most successful Eurovision nations >
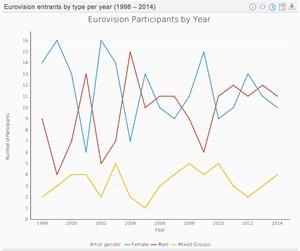
 Data visualization reveals success by gender at Eurovision >
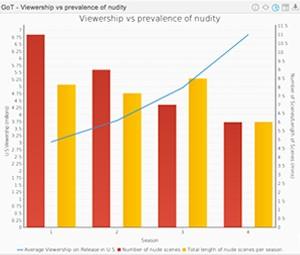
 Data visualization ’exposes’ nudity in Game of Thrones >
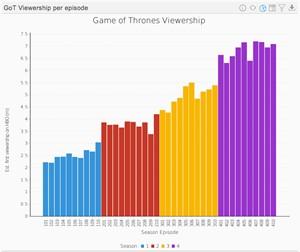
 Data Visualization reveals most popular Game of Thrones episode >
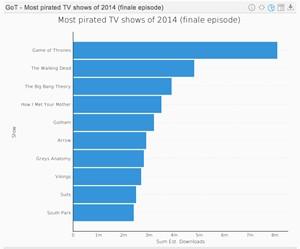
 Data Visualization: Game of Thrones the most pirated TV show >
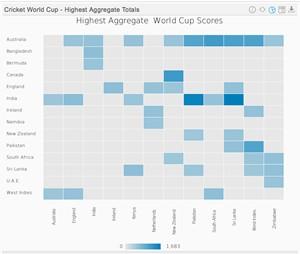
 Data viz predicts 2015 Cricket World Cup high scoring games >
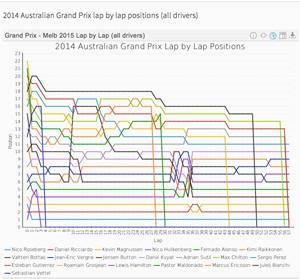
 Data visualization predicts 2015 Australian Grand Prix >
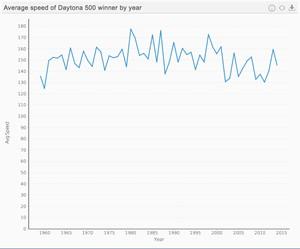
 Assessing Daytona 500 championship with Data Visualization >
-
- Barcelona ‘won’ more elements within the ‘positive’ category during its 2015 UEFA Champions League campaign (76%)
-
- Barcelona ‘won’ more elements within the ‘neutral’ category during its 2015 UEFA Champions League campaign (60%)
-
- Juventus ‘won’ more elements within the ‘negative’ category during its 2015 UEFA Champions League campaign (64%)
-
- Barcelona ‘won’ double the number of ‘elements’ compared to Juventus – be they positive, neutral or negative – winning 22 out of 37 total elements assessed (59%)
-
- Of the 22 elements that Barcelona won, 16 were positive (73%)
-
- Barcelona ‘won’ double the number of ‘elements’ compared to Juventus – be they positive, neutral or negative – winning 22 out of 37 total elements assessed (59%)
-
- Juventus ‘won’ half the number of ‘elements’ compared to Barcelona – be they positive, neutral or negative – winning 11 out of 37 total elements assessed (30%)
-
- Of the 11 elements that Juventus won, just three were positive (27%)
-
- Juventus ‘won’ half the number of ‘elements’ compared to Barcelona – be they positive, neutral or negative – winning 11 out of 37 total elements assessed (30%)
-
- There were only four elements out of 37 for which Barcelona and Juventus were tied – be they positive, neutral or negative, representing just 11% of total elements assessed
Data visualization exposes success by language at Eurovision >
Data visualization uncovers worst Eurovision performers >
Data visualization probes Eurovision wins by populace & GDP >
Data visualization shows Eurovision success rates by country >
Data visualization compares Eurovision winners & runners-up >
Data visualization reveals most unlucky Eurovision nations >
Data Visualization reveals advantage of hosting Eurovision >
Data visualization shows most successful Eurovision nations >
Data visualization reveals success by gender at Eurovision >
Data visualization ’exposes’ nudity in Game of Thrones >
Data Visualization reveals most popular Game of Thrones episode >
Data Visualization: Game of Thrones the most pirated TV show >
Data viz predicts 2015 Cricket World Cup high scoring games >
Data visualization predicts 2015 Australian Grand Prix >
Assessing Daytona 500 championship with Data Visualization >