By Eshan Wickrema and Lachlan James
The Chicago Blackhawks won the 2015 Stanley Cup Finals of the US National Hockey League (NHL) over an insistent Tampa Bay Lightning, claiming the series 4-2. In fact, all five games leading to the decisive sixth match were decided by just one goal.
But, what even the most avid Bolts and Hawks fans (and NHL fanatics in general) may not have known, is that Chicago, despite the tough competition, were firm favourites from the first game of the best-of-seven series.
‘How so’ you ask? We’ll show you how with Business Intelligence software and data visualization.
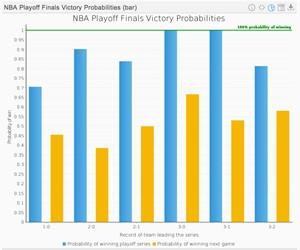
NHL Finals: Probability of victory by series-leading team (all-time)
Note: Statistics indicating the probability of the series-leading team winning the next Finals game, and the best-of-seven Finals series overall, were sourced from www.whowins.com/home.html
Insights
 Data Visualization: Barcelona’s 2015 UEFA win was inevitable >
 Data visualization predicts 2015 FA Cup Final >
 Data visualization exposes success by language at Eurovision >
 Data visualization uncovers worst Eurovision performers >
 Data visualization probes Eurovision wins by populace & GDP >
 Data visualization shows Eurovision success rates by country >
 Data visualization compares Eurovision winners & runners-up >
 Data visualization reveals most unlucky Eurovision nations >
 Data Visualization reveals advantage of hosting Eurovision >
 Data visualization shows most successful Eurovision nations >
 Data visualization reveals success by gender at Eurovision >
 Data visualization ’exposes’ nudity in Game of Thrones >
 Data Visualization reveals most popular Game of Thrones episode >
 Data Visualization: Game of Thrones the most pirated TV show >
 Data viz predicts 2015 Cricket World Cup high scoring games >
 Data visualization predicts 2015 Australian Grand Prix >
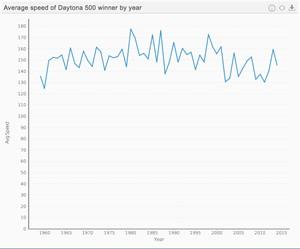
 Assessing Daytona 500 championship with Data Visualization >

-
- The team that clinches Game 1 of the NHL Finals series (The Chicago Blackhawks in 2015) goes on to win the series 77.3% of the time.
-
- Tampa Bay defied the odds in Game 2, levelling the series at 1-1, despite the fact they only had a 34.7% chance of winning after initially going down in the first game of the Stanley Cup.
-
- Even though the probability of securing a series victory was unlikely after giving up Game 1, The Lightning can actually consider themselves unlucky series losers from Game 4 onwards. After securing a 2-1 lead in Game 3, history indicated that Tampa Bay had an 81.3% chance of winning the series.
-
- Although, it’s interesting to note that the leading team in an NHL Finals series has the lowest probability of winning when heading into Game 4 with a 2-1 lead (52.1%).
-
- Even though the probability of securing a series victory was unlikely after giving up Game 1, The Lightning can actually consider themselves unlucky series losers from Game 4 onwards. After securing a 2-1 lead in Game 3, history indicated that Tampa Bay had an 81.3% chance of winning the series.
-
- The strongest position to hold in an NHL Finals series is 3-1 – teams in this position go onto win the series 96.9% of the time
-
- Curiously, teams holding an almost-insurmountable 3-1 lead only have a 56.3% chance of winning Game 5.
-
- Unlike the NBA Finals series, where no team has ever lost after holding a 3-1 (or 3-0) lead, at no stage in the NHL Finals does a team have a 100% probability of claiming the series.
-
- However, the team leading the best-of-seven NHL Finals always has the odds in their favour, with the chance of winning both the series and the next game always above 50%.
-
- Check out Yellowfin’s data blog on the NBA Finals HERE >
-
- Unlike the NBA Finals series, where no team has ever lost after holding a 3-1 (or 3-0) lead, at no stage in the NHL Finals does a team have a 100% probability of claiming the series.
-
- The strongest position to hold in an NHL Finals series is 3-1 – teams in this position go onto win the series 96.9% of the time
-
- The average winning percentage for teams playing at home in the NHL Finals is 57.9%
-
- The average winning percentage for teams playing on-the-road (away) in the NHL Finals is 30.7%
-
- While teams playing at home during the NHL Finals have enjoyed a winning edge over the history of the Stanley Cup, it’s clear that playing away is tough, with a winning differential of 27.2% compared to home games
-
- The average winning percentage for teams playing on-the-road (away) in the NHL Finals is 30.7%
Data Visualization: Barcelona’s 2015 UEFA win was inevitable >
Data visualization predicts 2015 FA Cup Final >
Data visualization exposes success by language at Eurovision >
 Data visualization uncovers worst Eurovision performers >
 Data visualization probes Eurovision wins by populace & GDP >
 Data visualization shows Eurovision success rates by country >
 Data visualization compares Eurovision winners & runners-up >
 Data visualization reveals most unlucky Eurovision nations >
 Data Visualization reveals advantage of hosting Eurovision >
 Data visualization shows most successful Eurovision nations >
 Data visualization reveals success by gender at Eurovision >
 Data visualization ’exposes’ nudity in Game of Thrones >
 Data Visualization reveals most popular Game of Thrones episode >
 Data Visualization: Game of Thrones the most pirated TV show >
 Data viz predicts 2015 Cricket World Cup high scoring games >
 Data visualization predicts 2015 Australian Grand Prix >
 Assessing Daytona 500 championship with Data Visualization >
