
By Eshan Wickrema, Steve Sorbello and Lachlan James
Let’s be honest with ourselves. Do we simply watch HBO’s smash hit Game of Thrones (GoT) for the nudity? With the season five premiere of GoT just around the corner (April 12th), it's worth considering your motivations for watching (because let's face it, it does consume a decent portion of your life!).
Insights:
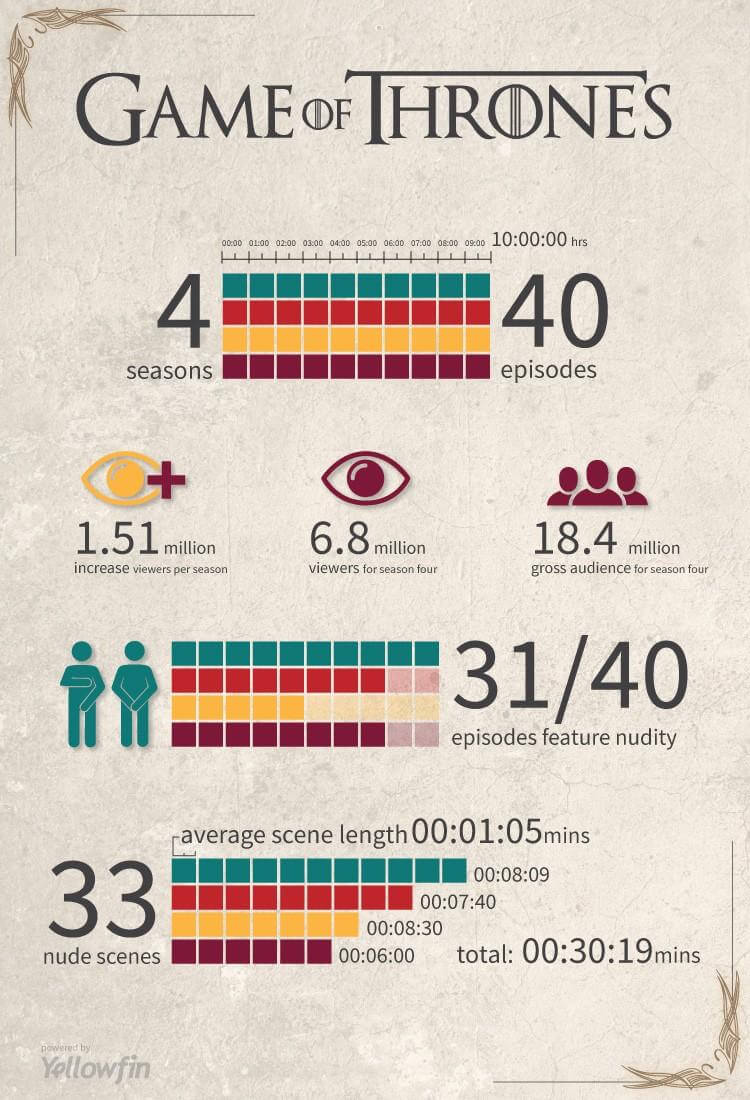
Exposing the naked truth behind Game of Thrones
As the above data visualization depicts, GoT doesn’t hold anything back – or keep much on – when it comes to nudity. The often full-frontal nature of the series has been well documented, with nudity portrayed in 31 out of the 40 episodes to date. The four seasons have combined for a cumulative total of 30:19 minutes worth of nude scenes – that’s longer than an episode of The Simpsons! This means the 33 nude scenes contained in the GoT saga have run for an average of 1:05 minutes each.
So is regular nudity really the formula to the series’ success? Or does it, and we, have a little more substance?
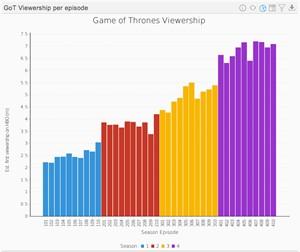
A correlation between viewership figures and incidents of nudity?
Using Business intelligence software, we can immediately see that the number of nude scenes per season has been declining since its peak of 11 (from just 10 episodes) in season one.
Now, what happens if we compare the number of nude scenes per season to official HBO viewership figures (discussed in our last GoT data blog, Data Visualization reveals most popular Game of Thrones episode)?
Insights
Conclusion: Game of Thrones nudity just a ‘draw card’
Despite GoT’s propensity to starkly position the human form in all its (sometimes) glory, it’s really only just used to lure people into what’s ultimately an enthralling narrative.
While the number of nude scenes, and the total minutes depicting nude scenes, has steadily decreased season-to-season, its popularity has soared. Official HBO viewership estimates indicate that the US audience alone climbed from an average of three million per episode in season one to over 3.8 million in season two, 4.97 million in season three, and 6.85 million in season four.
We recommend
Data Visualization reveals most popular Game of Thrones episode >
Data Visualization: Game of Thrones the most pirated TV show >

Data viz predicts 2015 Cricket World Cup high scoring games >

Data visualization predicts 2015 Australian Grand Prix >

Assessing Daytona 500 championship with Data Visualization >

Let’s be honest with ourselves. Do we simply watch HBO’s smash hit Game of Thrones (GoT) for the nudity? With the season five premiere of GoT just around the corner (April 12th), it's worth considering your motivations for watching (because let's face it, it does consume a decent portion of your life!).
Insights:
- A staggering 77.5% of episodes (31 of 40) have featured a nude scene
- The first four seasons of GoT contained a total of 30 minutes of nude scenes
- There have been 33 nude scenes, at an average of just over 1-minute each
Exposing the naked truth behind Game of Thrones
As the above data visualization depicts, GoT doesn’t hold anything back – or keep much on – when it comes to nudity. The often full-frontal nature of the series has been well documented, with nudity portrayed in 31 out of the 40 episodes to date. The four seasons have combined for a cumulative total of 30:19 minutes worth of nude scenes – that’s longer than an episode of The Simpsons! This means the 33 nude scenes contained in the GoT saga have run for an average of 1:05 minutes each.
So is regular nudity really the formula to the series’ success? Or does it, and we, have a little more substance?
A correlation between viewership figures and incidents of nudity?
Using Business intelligence software, we can immediately see that the number of nude scenes per season has been declining since its peak of 11 (from just 10 episodes) in season one.
Now, what happens if we compare the number of nude scenes per season to official HBO viewership figures (discussed in our last GoT data blog, Data Visualization reveals most popular Game of Thrones episode)?
Insights
- Season one featured the most nude scenes (11), with a declining trend across seasons two (9), three (7) and four (6)
- With the exception of season three (8:30 mins), the total amount of nudity shown per season has dropped from season one (8:09 mins), to season two (7:40 mins) and season four (6:00 mins)
- Whilst season four was easily the most popular season in terms of viewership, with an average of 6.85 million American’s tuning in to HBO per episode, it contained the least amount of nudity
Conclusion: Game of Thrones nudity just a ‘draw card’
Despite GoT’s propensity to starkly position the human form in all its (sometimes) glory, it’s really only just used to lure people into what’s ultimately an enthralling narrative.
While the number of nude scenes, and the total minutes depicting nude scenes, has steadily decreased season-to-season, its popularity has soared. Official HBO viewership estimates indicate that the US audience alone climbed from an average of three million per episode in season one to over 3.8 million in season two, 4.97 million in season three, and 6.85 million in season four.
We recommend
Data Visualization reveals most popular Game of Thrones episode >
Data Visualization: Game of Thrones the most pirated TV show >
Data viz predicts 2015 Cricket World Cup high scoring games >
Data visualization predicts 2015 Australian Grand Prix >
Assessing Daytona 500 championship with Data Visualization >