TL;DR
Embedded analytics are vital for user engagement. Companies like Stripe, Uber Eats, and Intercom use them to provide real-time, in-app insights. Instead of building this complex functionality from scratch, a solution like Yellowfin allows you to quickly embed powerful, white-labeled analytics, providing a great user experience with less development effort.
Don’t just take our word for it - try Yellowfin for yourself by requesting a free trial.
Ever stop to think what happens when you order that late-night pizza on Uber Eats?
Behind the scenes, the restaurant owner isn’t just tossing dough and hoping for the best. They’re watching live dashboards that show which dishes sell fastest, when peak demand hits, and how delivery times affect their ratings.
Or think about Stripe. The moment your payment goes through, the business on the other side sees real-time analytics on revenue, refunds, and churn risk.
That’s the power of embedded analytics platforms. The insight doesn’t sit in a dashboard waiting to be discovered. It shows up at the exact moment it’s needed.
Why Stripe puts in-app analytics on its homepage?
Stripe might be known for payment processing, but it's also a poster child for built-in user analytics. The moment a Stripe user logs in, they're greeted with an overview dashboard full of useful business metrics. Even though analytics aren’t Stripe’s core offering, their business intelligence dashboard sits right on the homepage, underlining how valuable these insights are.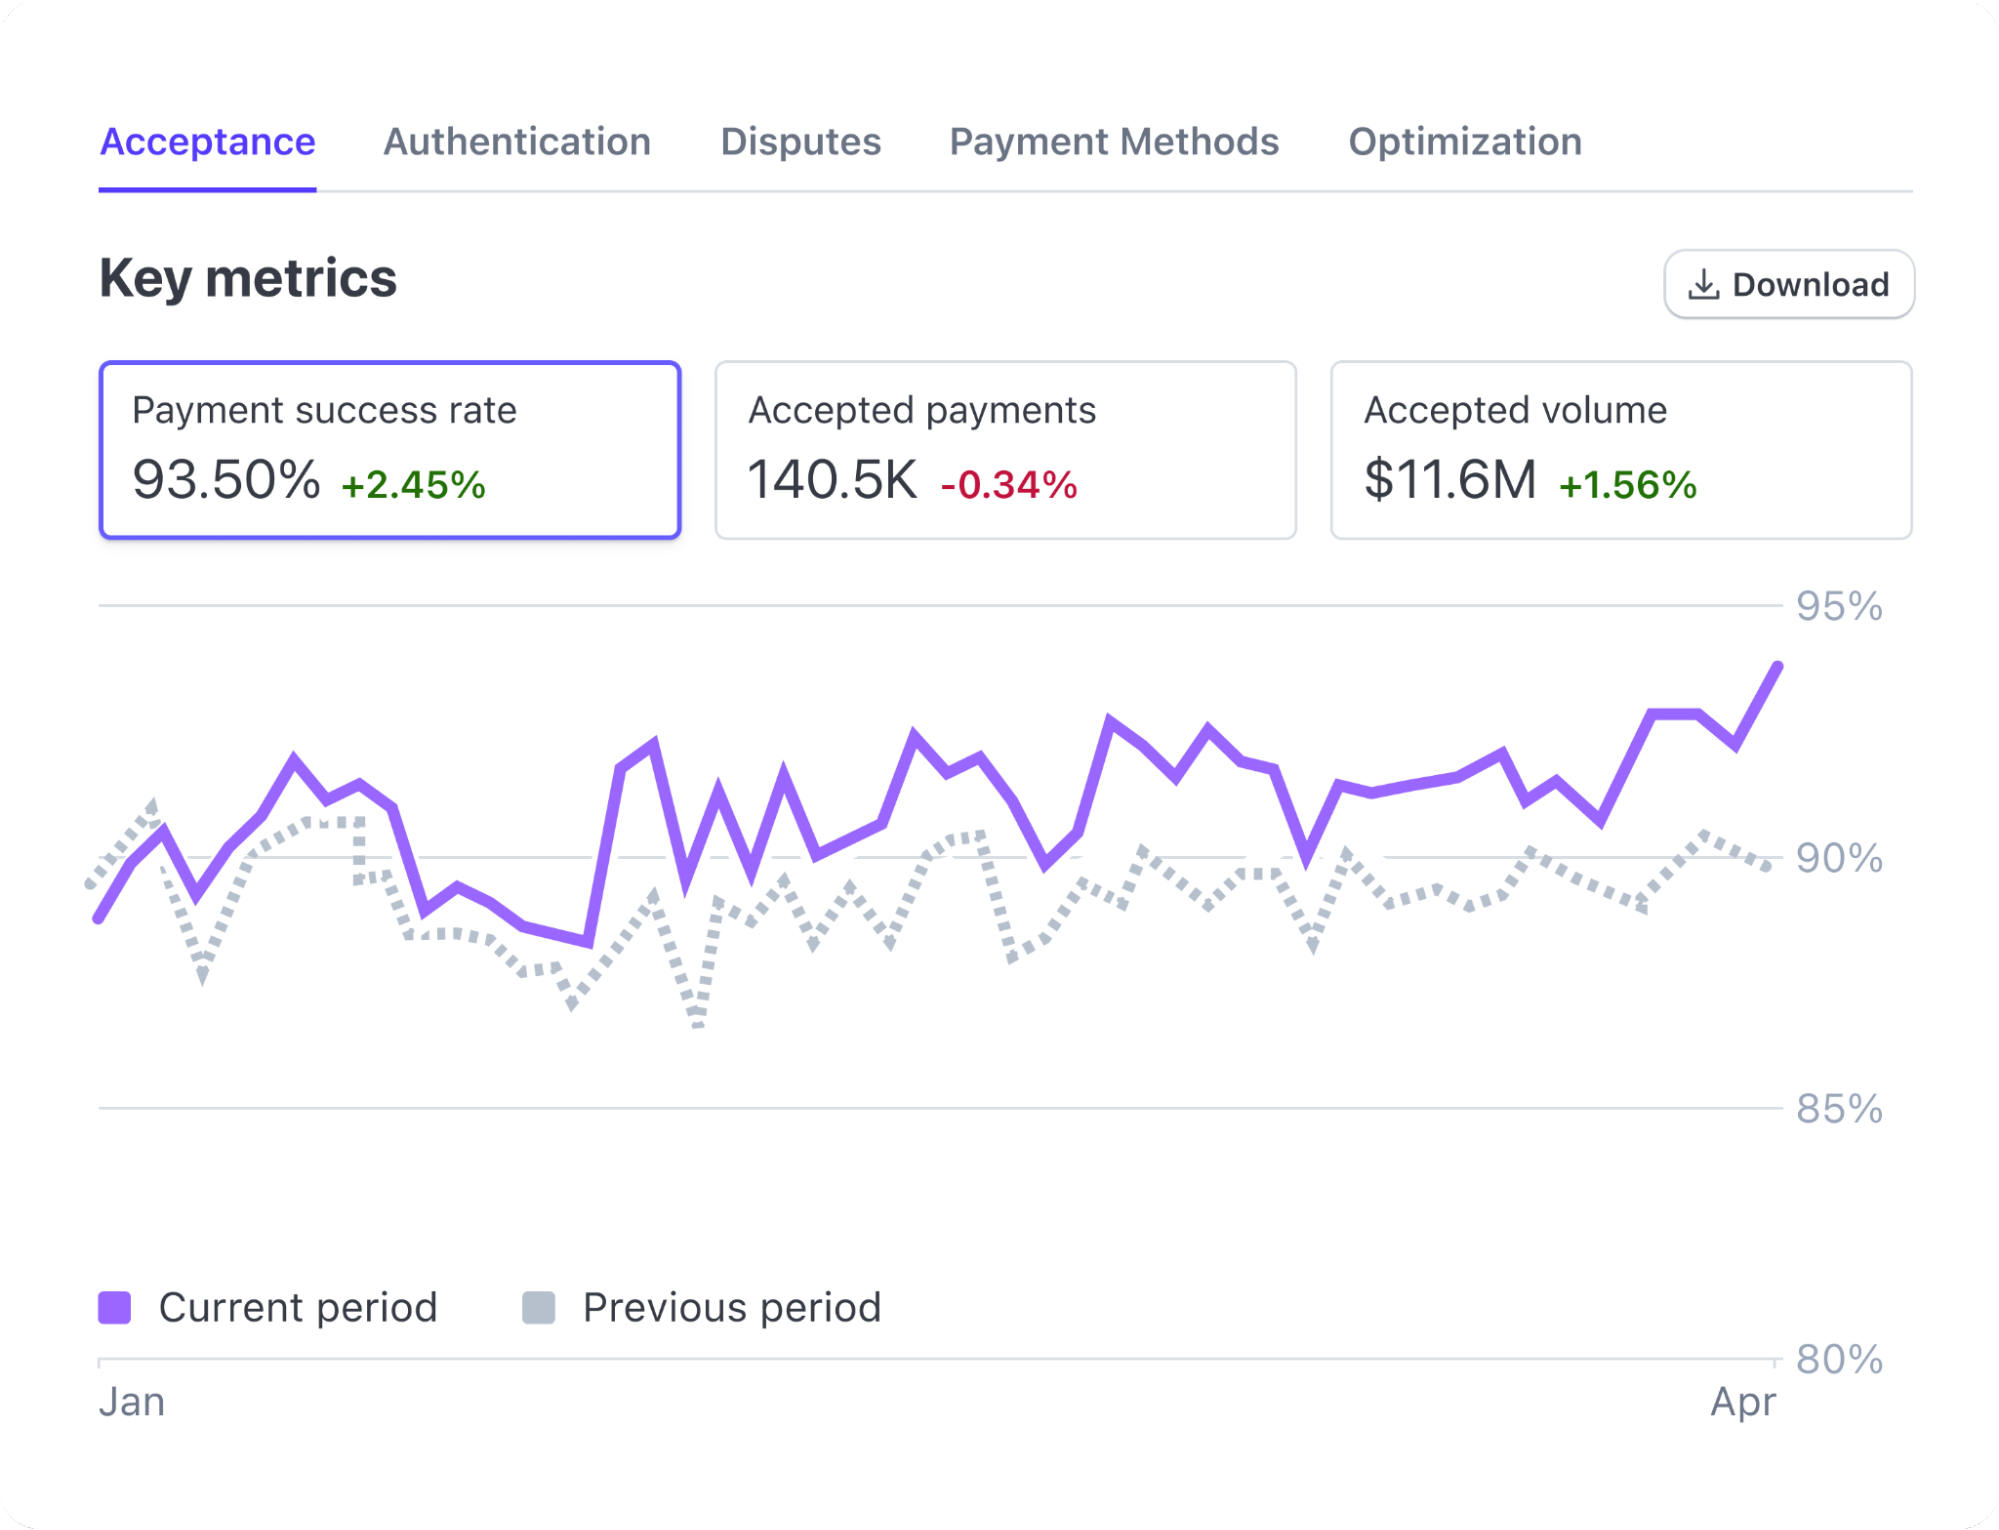 Users can immediately see key numbers like their payments for a given period and how those compare to previous periods, all crucial for gauging a business’s financial health.
By surfacing this data in real time, Stripe empowers businesses to make decisions without waiting on manual reports.
It’s no surprise that Stripe serves millions of businesses and processes over $1 trillion annually (roughly 1% of global GDP) – a testament to how a great analytics experience can drive massive adoption and customer satisfaction.
Users can immediately see key numbers like their payments for a given period and how those compare to previous periods, all crucial for gauging a business’s financial health.
By surfacing this data in real time, Stripe empowers businesses to make decisions without waiting on manual reports.
It’s no surprise that Stripe serves millions of businesses and processes over $1 trillion annually (roughly 1% of global GDP) – a testament to how a great analytics experience can drive massive adoption and customer satisfaction.
How Uber Eats serves restaurants with real-time insights?
Uber Eats took a similar approach for its restaurant partners. They built an analytics hub called Restaurant Manager to give restaurants real-time visibility into how they're performing on the platform. In fact, Uber found that one of the most frequent requests from restaurant partners was more business insights, so they delivered exactly that.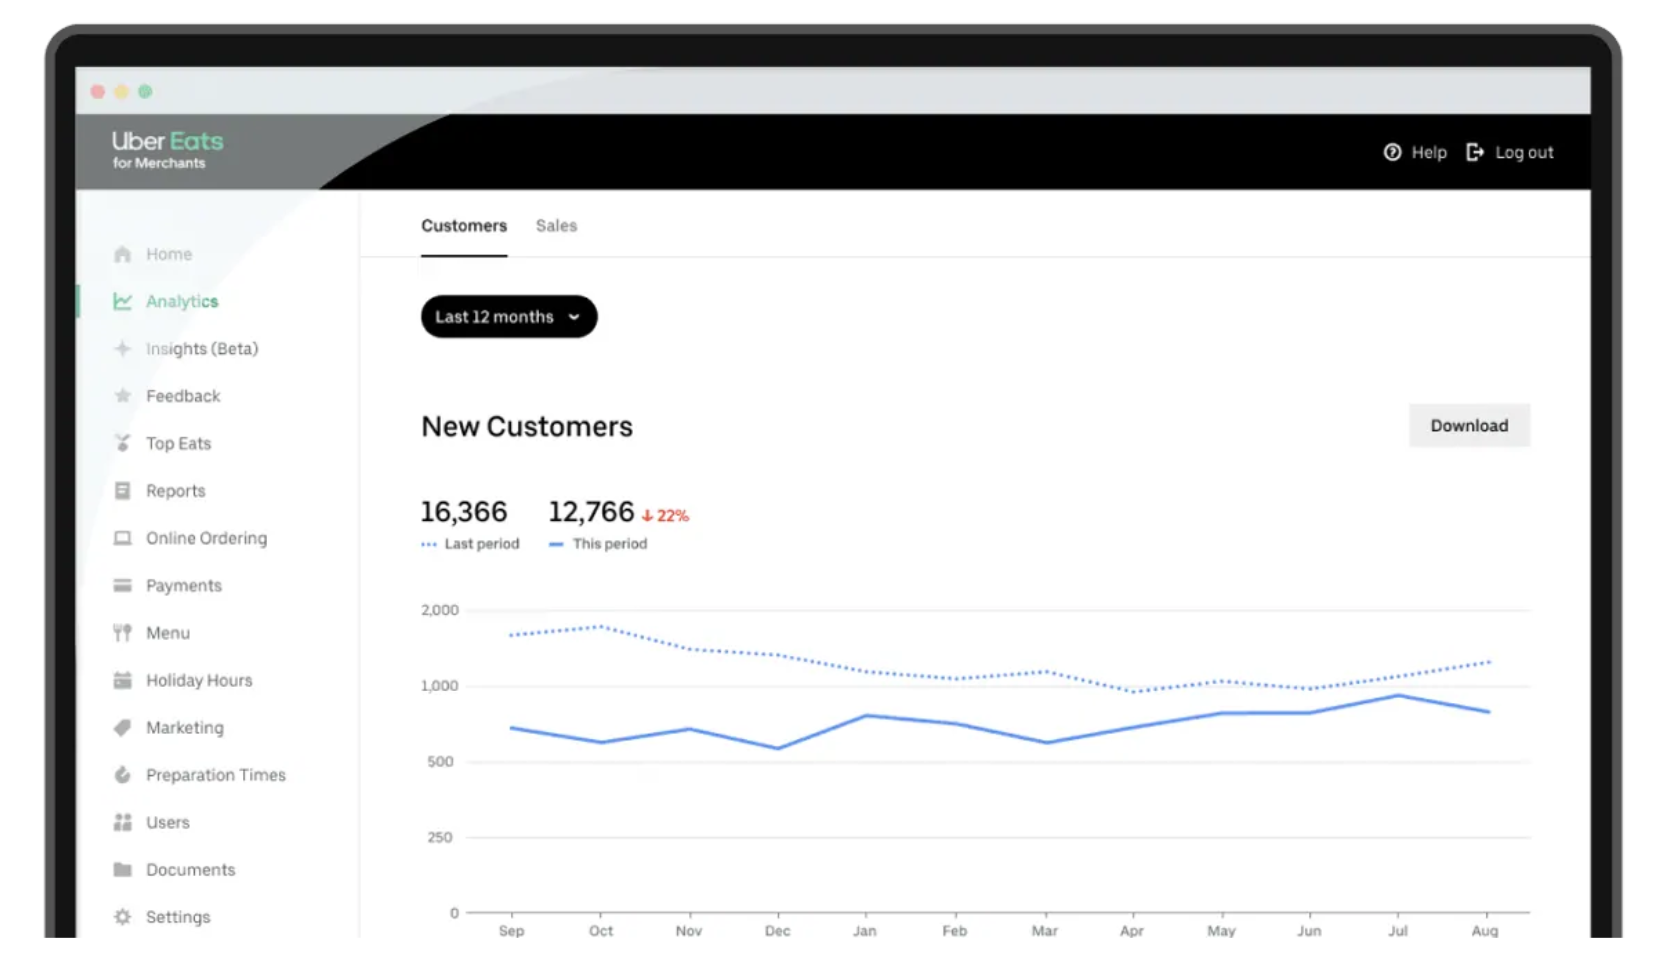 Restaurant Manager breaks down key metrics into categories like customer satisfaction, sales, and service quality. It covers everything from financial stats (e.g. net payouts and items sold) to operational metrics (order acceptance rate, prep time, menu ratings), all of which help restaurants improve their service and boost sales.
How does Intercom show team performance in real time?
Intercom, a customer messaging platform, turns support team data into a native part of the user experience. Inside Intercom, managers have a real-time KPI dashboard that makes it easy to track customer support metrics and team KPIs. The interface highlights key stats at a glance (for example, how many conversations are waiting for a reply right now) so support leads can see their team’s status in real time.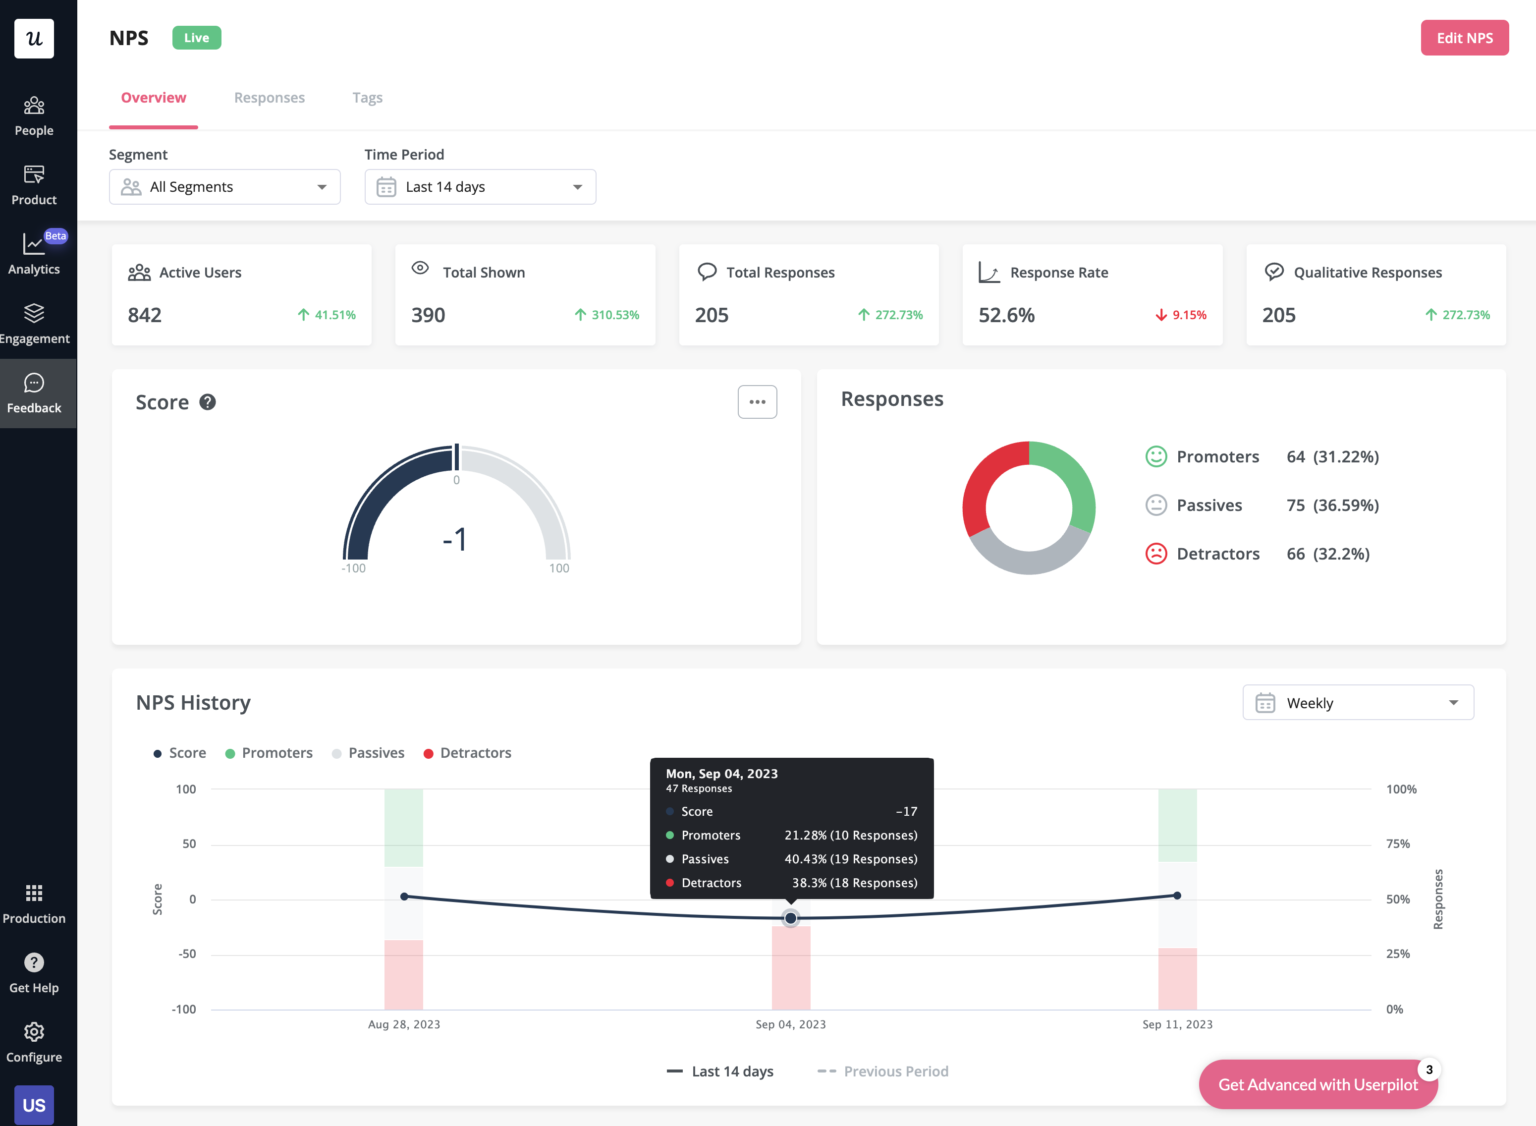 What makes Intercom’s analytics especially powerful is that managers can tailor it to their needs. They can add their own charts (counts, line graphs, tables, etc.), group and filter the data by different attributes, and there’s essentially no limit to how much they can customize the view.
This built-in flexibility means each team can focus on the metrics that matter to them. The result? Team leaders are practically glued to the Intercom dashboard, checking it throughout the day to monitor service levels and respond to issues before they escalate.
And because the analytics are part of Intercom’s familiar UI, with the same look and feel, users don’t feel like they’re using a separate tool.
Related reading: White Label Analytics: What It Is, Why It Matters & 5 Key Benefits
What makes Intercom’s analytics especially powerful is that managers can tailor it to their needs. They can add their own charts (counts, line graphs, tables, etc.), group and filter the data by different attributes, and there’s essentially no limit to how much they can customize the view.
This built-in flexibility means each team can focus on the metrics that matter to them. The result? Team leaders are practically glued to the Intercom dashboard, checking it throughout the day to monitor service levels and respond to issues before they escalate.
And because the analytics are part of Intercom’s familiar UI, with the same look and feel, users don’t feel like they’re using a separate tool.
Related reading: White Label Analytics: What It Is, Why It Matters & 5 Key Benefits