Business intelligence (BI) and analytics solutions empower non-technical business people and experts to make better decisions and improve business performance, and its importance has been illustrated by the huge growth of the industry in the last few years.
Various sources estimate the BI market to reach over $40B in the next five years. According to Fortune Business Insights, the global BI market is projected to grow from $24.05 billion in 2021 to $43.03 billion in 2028, at a CAGR of 8.7% in forecast period.
This rapid growth has created a wide variety of solutions and tools in the BI and analytics market. Tableau and Power BI are two such ubiquitous examples, but there are scores of others that make navigating and selecting the space extremely difficult.
In this blog, we detail the spectrum of BI and analytics solutions on offer today, and why it’s important to understand how each tool covers certain data needs better than others.

Aligning Data Challenges with the Right Analytics Solution
One way to classify the spectrum of BI and analytics tools is by understanding the problems that they solve. Each business and BI problem has different characteristics:- The state of the data in terms of its quality, and the degree to which it is structured (or not) for analytical analysis
- The level of data literacy and skill of the users who undertake the work to identify the insights
- The level of data literacy and skill of the users who will consume the insights
- The degree to which the insights are repeatable and predictable, or whether each insight discovery is bespoke
- The business wants to know which customers might have a higher propensity to churn, but do not know the characteristics that predict churn. A raw data set such as a click-stream from a website has been obtained as well as customer subscription data from a customer relationship management (CRM) system. The data is in a raw form and has not been structured in any way to support analytics, for example dimensions are not standardized and denormalized, metrics have not been pre-calculated, data has not been summarized for high-speed query performance. This type of solution requires specialist tools and skills in order to extract the insights needed.
- A purchasing manager in a retailer receives a low-stock level warning from their stock control system. The manager wants to place an order to avoid a stock-out. The stock control system has embedded analytics that provide insights to the manager to help them place the best order, including comparative analysis of each vendor that supplies that product including historic order volumes, seasonal discounting patterns, levels of returns etc. The manager does not possess any specific data literacy skills, but the right analytics have been delivered in-context within the application and workflow.
1. Contextual BI
Contextual BI, also commonly referred to as contextual analytics, is an evolution of the embedded analytics model that places analytics more directly into an application, with the intention of making data access and analysis synonymous with the app’s core workflows. This delivers data to line-of-business users right at the point of their daily work using the app (within the UI and transaction flow of the app), helping optimize efficiency, provide context behind the numbers, and guide everyday decision making. Only a few specialized commercial BI tools cater to this growing business need at this time. Features- Highly structured databases optimized for analytics and performance - (Data Mart)
- Mostly known and repeatable use-cases data needs
- Structured delivery via reports and dashboards, embedded into workflows for optimal efficiency and context
- Insights shared enterprise-wide
- Typically sought after/used by high business SME, low data literacy

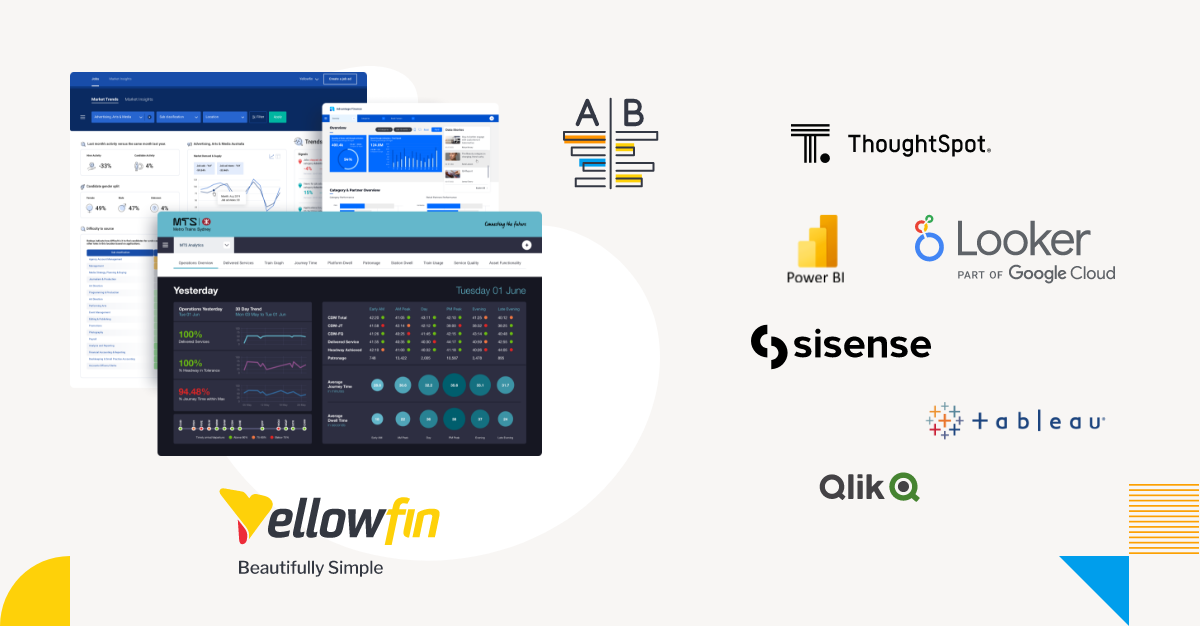
Example of Yellowfin Contextual Analytics Dashboard in action.
2. Custom BI Apps
The need for customized business intelligence applications for specific business use cases is growing rapidly each year, with a small but prominent number of commercial solutions available. Features- Highly structured databases optimized for a specific use case
- Narrow, well-defined use-cases (ie. instrumentation and telemetry of business processes)
- Highly targeted delivery often via a single visualization, almost always embedded into a business process workflow
- Insights consumed during the workflow process
- Typically sought after/used by high business SME, low data literacy

An example of FusionCharts embeddable charts into custom BI apps.
3. Data Discovery
Data discovery is the ability to collect data from relevant sources and explore it to identify insights. This is achieved through the use of visual-based tools and advanced analytical features, of which there are several commercial BI tools/options available. Features- Standard BI methods, including data visualization drive data discovery
- More structured data (data warehouse) or commonly personal data sets (xls, csv)
- Broadly defined areas for insight discovery
- Insights shared departmentally via collaboration tools, data sharing
- Typically sought after/used by skilled data analysts / business SME
4. Research and Exploration
Research and exploration refers to more technical analysis of business data (typically raw, unstructured data) by analysts or experts with technical knowledge. This is supported by a number of long-standing commercial solutions that cater to those with SQL and R-Language knowledge. Features- Raw, unstructured data (data lake)
- Ill-defined or one-off questions
- Specialist algorithms needed to extract insight
- Insights shared via custom reports
- Typically sought after/used by specialist skill sets (data science, data engineer)
Conclusion
Understanding the BI and analytics solutions spectrum can be hard without a guide - we hope our article has provided you with a helpful summary of where the current spectrum of BI tools in the market fit according to the most prominent problem spaces and business requirements at this time. For more information on how Yellowfin can fit your use case needs, contact our team for more information.