
Data visualization is one of the most important capabilities of any business intelligence (BI) and analytics solution. It helps people translate complex data into a visual context, like a chart or a graph, identify trends numbers alone can't easily reveal, and discover hidden patterns in your dashboard.
Data visualization also provides a wealth of additional benefits for data analysis, such as enabling easier understanding of the correlation between operations and results. By properly utilizing this information, you can make significantly better business decisions.
In this blog, we detail 7 benefits of data visualization tools and business software that you should be getting from your BI solution.
Data visualization business software: A Refresher
The purpose of data visualization business software is to enable organizations to transform complex datasets into interactive visual formats, and help everyone from non-technical business professionals to advanced developers analyze trends, patterns, and key metrics more efficiently, leading to better decision-making.
The benefits of data visualization extend beyond aesthetics, as these tools can also improve data comprehension, enhance collaboration, and drive business intelligence strategies - when following the right dashboard design considerations.
The importance of data visualization tools in business
The importance of data visualization goes beyond just presenting numbers in a graphical format.
When deployed correctly as part of your business intelligence dashboards, the use of graphs, charts, heatmaps and the many other types of data visualization can help improve efficiency, strategy, and communication related to your business reporting and data analysis processes.
Today, many companies use best-in-class embedded data visualization tools to track performance in real-time and represent key metrics in interactive formats to make better data-driven decisions - rather than rely on static, tabular reports, which can sometimes be hard to understand for certain business stakeholders.
In summary, data visualization software is adopted to:
Simplify complex data
Instead of sifting through endless reports, businesses can use visual dashboards to understand key metrics at a glance.
Improve communication across teams
Visual data makes it easier for different departments to collaborate and align on business goals.
Help spot opportunities and risks
With real-time analytics, businesses can identify emerging trends and potential data risks before they impact operations.
Now that you know what is data visualization and why is it important, let's cover its benefits in greater detail.
Key benefits of data visualization tools
First thing’s first - if you are familiar with modern data visualization options, or the concept of data viz, we recommend you read our free guide, What is Data Visualization and its Importance in Business Intelligence?
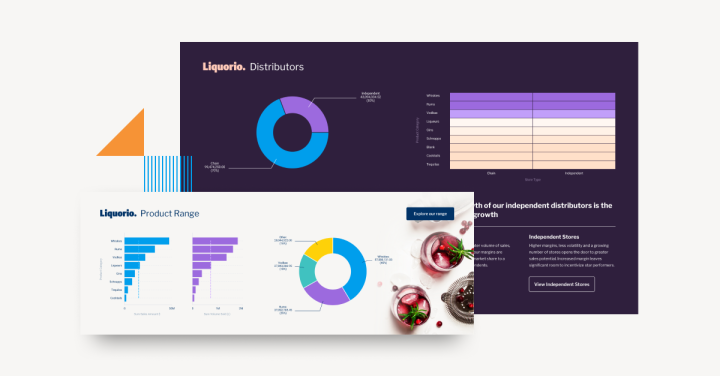
Visualizing data is made possible with specialized data visualization software that graphically renders complex information. They utilize different formats of visualization, such as graphs, charts, or heatmaps, to represent massive datasets. As a result, you can easily analyze large amounts of data, compared to having to sift through tables or reports full of raw metrics. To create simple and effective charts quickly, businesses can also use a bar graph generator to turn raw data into clear visual insights without complex tools.
Ultimately, these tools help you to quickly understand key insights and make timely business decisions. The best tools to visualize data on the market are Yellowfin, Microsoft Power BI, and Tableau. We have a guide linked below that can help you get up-to-speed.
Here are the key benefits of data visualization tools:
Better business decisions
Data visualization enables you to effortlessly create intuitive and interactive visualizations. Hence, you can quickly analyze complex datasets in your dashboards.
It helps you to easily find key insights. Data visualization software, like Yellowfin, Power BI and Tableau and Powerdrill, simplifies the process of representing complex data in an easily understandable format for everyone using simple visual formats, like charts and graphs. People tend to understand visual things quicker than written forms, like reports.
By visually presenting the information in your dashboard, you can make complex data easily understandable and accessible for everyone.
As a result, the data visualization tool can enhance collaboration and communication in the decision-making approach. Also, it can significantly reduce imprecision in data. Hence, you can make significantly better business decisions, and grow your company.
Easier trend analysis and exploration
The best data visualization tools, like Yellowfin and Power BI, enable effortless trend analysis. They help you to quickly analyze current and historical events, and predict future events, like potential growth or decline of sales and revenue for the next year.
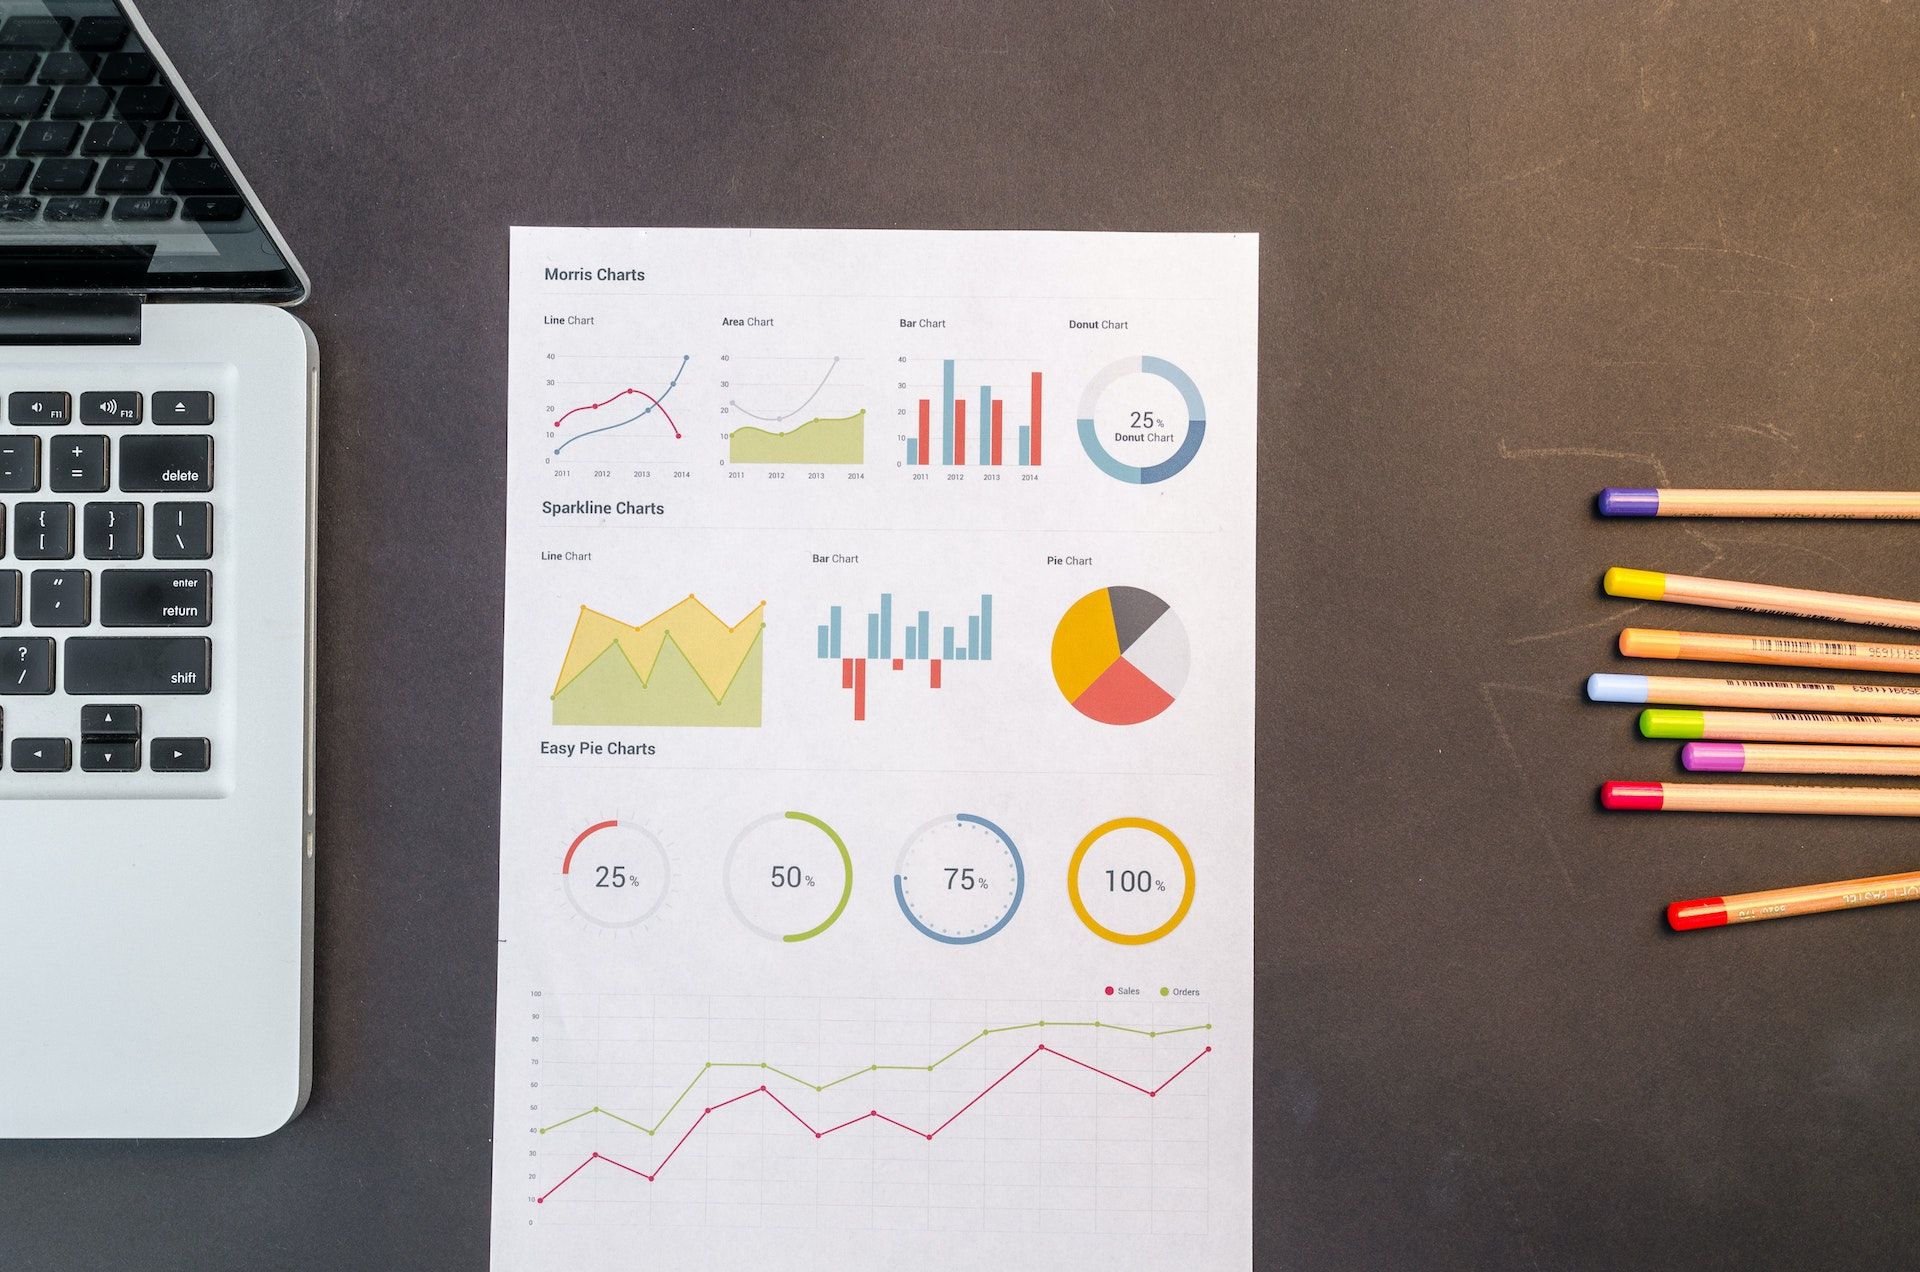
You can use different types of visualizations to perform trend analysis. Examples include the Area Graph, Line Graph, Histogram, Bubble Chart, Spiral Plot, and Steam Graph.
These solutions typically provide detailed dashboard and visualization design tools so that you can apply best practices to your chosen charts and graphs, such color, font, and rich media customization to make each visual custom-tailored for your intended audience - and visually appealing. Some tools, such as Yellowfin, provide a wide array of lesser available visualization types in addition to extensible tooling.
Read: 10 Essential Types of Data Visualization
Identify correlation between operations and results faster
Correlation is one of the most important tools in statistics. It helps you to discover the relationships among independent variables through data visualizations. This is one of the most crucial benefits of data visualization tools that allow businesses to quickly identify key patterns and trends.
In business intelligence, it is very important to find a correlation between business functions and market performance. It helps you to stay ahead in the competition, track connections between operations and overall business performance, and more effectively make important strategic decisions to beat the competition and grow your company.
Related: Why Operational Reporting is Still Important in Modern BI
More accurate customer sentiment analysis
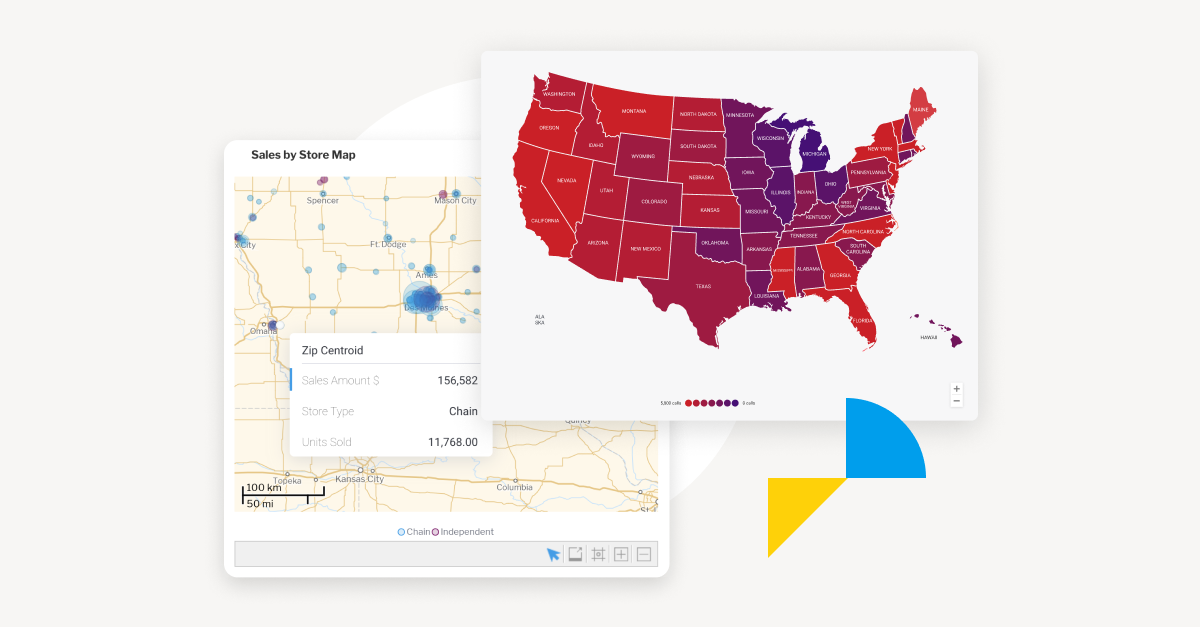
Data visualization can help dig deeper into customer sentiments, presenting the analysis on interactive charts, reports, and dashboards rather than complicated and messy spreadsheets.
With graphs and charts, you can more easily understand and share insights with others into what people think about your brand, or how your business operations are performing as a whole. It allows you to get into the psyche of your target audience, understand their pain points and preferences, and utilize analytics to create significantly better business strategies.
Foster more business users to interact with their data
One goal of adopting and using visualization tools is to make the data accessible to everyone throughout the organization. By utilizing data visualization as part of your reporting efforts (and following best practices), it will encourage your users to explore and manipulate data to uncover important factors using said tools and foster a data-driven culture versus a traditional, intuition-based approach to making decisions.
Think of a scenario where you are seeing the sales of a specific item going down. There can be several reasons behind it. But which is the root cause? By using graphs and charts to represent your journey from identification to insight, you can more actively explore and correlate such a trend to actual item sales and a root cause, demonstrating the value of the solution overall to the enterprise and to your software users.
Read more: 9 Key Features of Enterprise Data Visualization Software
A window into automated reporting and contextualized data
Artificial intelligence (AI) and machine learning (ML) technologies can make information more understandable and useful. Powerful data visualization solutions, like Yellowfin BI and Power BI, support and integrate such technology into their visualization tools to improve the accuracy of results over time (via auto-generated comparisons, explanations, alerts and more).
Also, Yellowfin supports another important analytics feature called Natural Language Query (NLQ). NLQ helps you to create more accessible and usable business intelligence reports by understanding the context behind data, and shows you how to build the right question to ask of your data to look in the right places before generating best practice data visualizations to the end-user. As a result, you will get more actionable metrics from the datasets.

Data visualization software helps you to uncover hidden trends. They help you to discover patterns and relationships that are not easily discernible from complex datasets. As a result, you can obtain deeper insights and interrelationships.
For example, sales forecasts created with data visualization tools tend to be very accurate. Because the tools utilize advanced technologies to find hidden patterns. Also, they visualize the information through different charts, including bar charts and line charts. Hence, you can easily get deeper and more accurate insights into the market. The benefits of data visualization tools become more evident as these insights enable more informed decision-making and strategic planning.
Is Yellowfin really the best data visualization tool on the market?
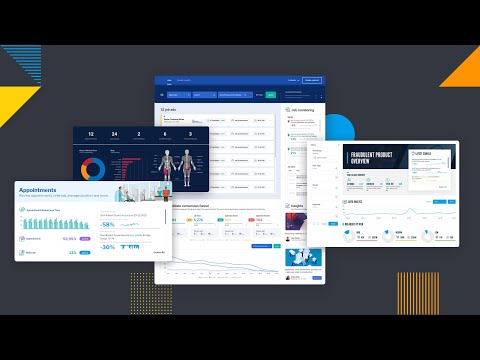
Yellowfin enables you to create stunning visualizations. You can use them to develop a compelling dashboard, data story, and presentation. It enables everyone on your team to see and understand trends and patterns in complex data.
Yellowfin supports over 50 chart types, including bar charts, line charts, and trellis charts. By utilizing them, you can create stunning visualizations. It even lets you utilize your favorite JavaScript charting libraries, such as D3 and Highcharts. As a result, you can create visuals in the way you like. Also, Yellowfin supports modern tables, text, and typography. Besides, it allows you to use different shapes to highlight or draw attention to data. On top of that, it utilizes AI, ML, and NLQ to uncover hidden patterns and deeper insights. As a result, Yellowfin is one of the best data visualization tools on the market.
FAQs (Frequently Asked Questions)
What are the four pillars of data visualization?
The four pillars are clarity, accuracy, efficiency, and storytelling. They ensure data is easy to understand, precise, quickly interpreted, and meaningful.
What are the advantages and disadvantages of data analysis?
Data analytics has several benefits to offer, like decision-making, identifying trends, and improving efficiency. However, analytical applications have few disadvantages: it is time-consuming, requires expertise, and has the risk of misinterpretation.
How to choose data visualization tool?
While choosing a data visualization tool, you'll have to look at data complexity, integration needs, ease of use, customization options, and cost to find the right tool for your business.
Take Your Reports to the Next Level with Data Visualization Tools
Turn raw data into stunning visuals, uncover hidden insights, and make smarter decisions faster. Explore the power of interactive dashboards and charts today.