

How Yellowfin Complements Tableau to Expand Analytics Use Cases
When it comes to analytics capability that caters to diverse data needs across the entire business, Yellowfin provides specific advantages compared to Tableau in several areas.
Tableau users may find the platform can be complex, or lacking, in areas such as dashboard design, data governance, or flexibility. Thankfully, many have found Yellowfin to be a great alternative, and even complementary solution, to their analytic needs.
From architecture to ease-of-use to unique augmented analytics features, this blog will detail some of Yellowfin’s key differentiators compared to competitors such as Tableau.
1) End-User Ease of Use
As an end-to-end analytics platform, Yellowfin is specifically designed to be highly customizable and accessible for both line-of-business professionals (non-technical) and power users (advanced users, such as developers, IT and analysts) to use. We find many of our customers come to us from Tableau and other platforms for this reason.
Once implemented, Yellowfin is easier to utilize than any other solution, owing to its unique features which simplify the experience so that business users and experts alike can streamline their analytic workflow and spend more time focusing on their use cases.
Yellowfin achieves this increased level of ease-of-use through its unique integration of augmented analytics technologies, which include artificial intelligence (AI), automation, machine learning and natural language query. The way we leverage these sophisticated technologies to streamline the process of exploring data empower data experts and everyday business professionals to create, consume and share data insights, and helps open up data-driven analysis and decision-making across the full organization.


For example, our implementation of Natural Language Query (NLQ), via our exclusive Guided NLQ feature, allows for fully guided self-service reporting. The tool can be used to help the user (whether non-technical or a data expert) build a data question based on pre-built parameters that the system automatically generates. Guided NLQ then produces a useful visualization or report that answers the user’s query, which can be built upon further and brought into a future dashboard or report. This a fully-guided process built into the system to step users through how to ask a question without having to learn or know how to ask a data query beforehand.
Similarly, our AI-powered Assisted Insights feature provides an easy way to compare or explain the ‘why’ behind data points on a dashboard, with a click.
Yellowfin’s unique embedded analytics capability, also referred to as contextual analytics, provides more options to use only components of Yellowfin that are needed. A specific deployment can opt to integrate the core dashboard and data visualization functionality of Yellowfin, or, if they have an in-built reporting solution already, enhance it with embedding of our Guided NLQ tool, or Signals, our unique automated business monitoring feature.


In comparison, Tableau can sometimes be limiting for certain users. Its Explain Data and Ask Data capabilities similarly support interactive explanations and data querying, but these tools still often require heavy curation of data sources beforehand by a data analyst (as Tableau itself recommends) to work effectively and begin answering questions, as well as feel natural to use for the general business analytics audience. Its Ask Data feature is also not fully guided and relies on the user to type a query that makes sense to the system, which means if you don't know where to start, a user can easily be lost and not get the expected value out of an otherwise very useful analytic capability.
This traditional route of focusing on data experts is why Yellowfin’s many features were instead designed with ease-of-use for the business user first, rather than second.
2) Centralized vs Decentralized BI Approach
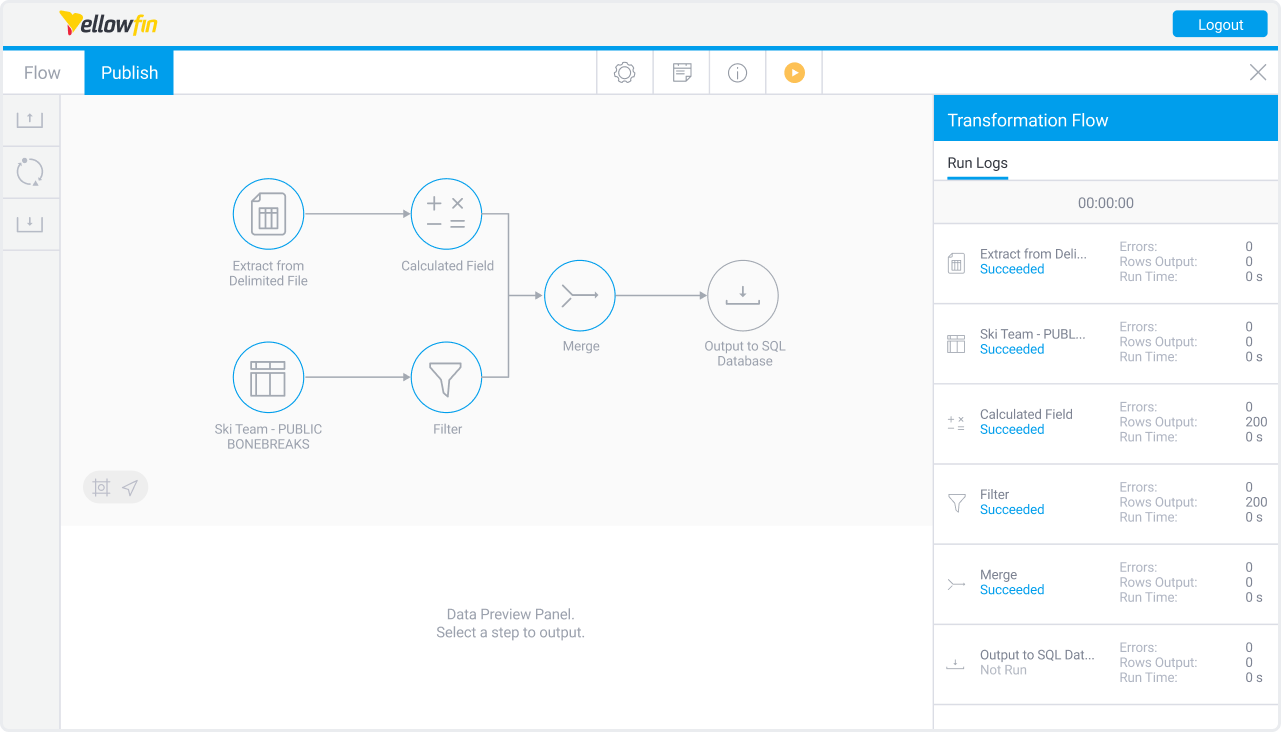
Yellowfin is designed for centralized analytics and reporting management, compared to competitors like Tableau. Control, security and data preparation and connection is all configurable in the same central interface, rather than across separate versions of the suite. Below are some aspects and considerations that differentiate our approach:
Centralized BI (Yellowfin)
- All core functions are centralized in one place.
- All data access control and authorization settings can be completed in one place.
- All metadata and content are secure and automatically reusable with appropriate access controls.
- Yellowfin always has a live connection to get the latest data.
- Dashboards can be configured and customized centrally eliminating the need to customize local dashboards for each user.
Decentralized BI (Tableau)
- There is a difference in functionality between the Desktop tool for creating and configuring data and the server software used primarily for sharing data.
- Some data access control and permission settings need to be configured in the Desktop tool and uploaded to the server.
- There is a back-and-forth between the server and the desktop tool, and reusing content is time-consuming.
- Live connections can be set up, but extraction to the built-in in-memory DB may be recommended for performance reasons.
The importance of providing organizations the ability to manage their analytics implementation in one secure, easy-to-access place cannot be understated - and it’s why Yellowfin is so focused on providing centralized BI to all businesses, big and small.
3) Dashboard flexibility
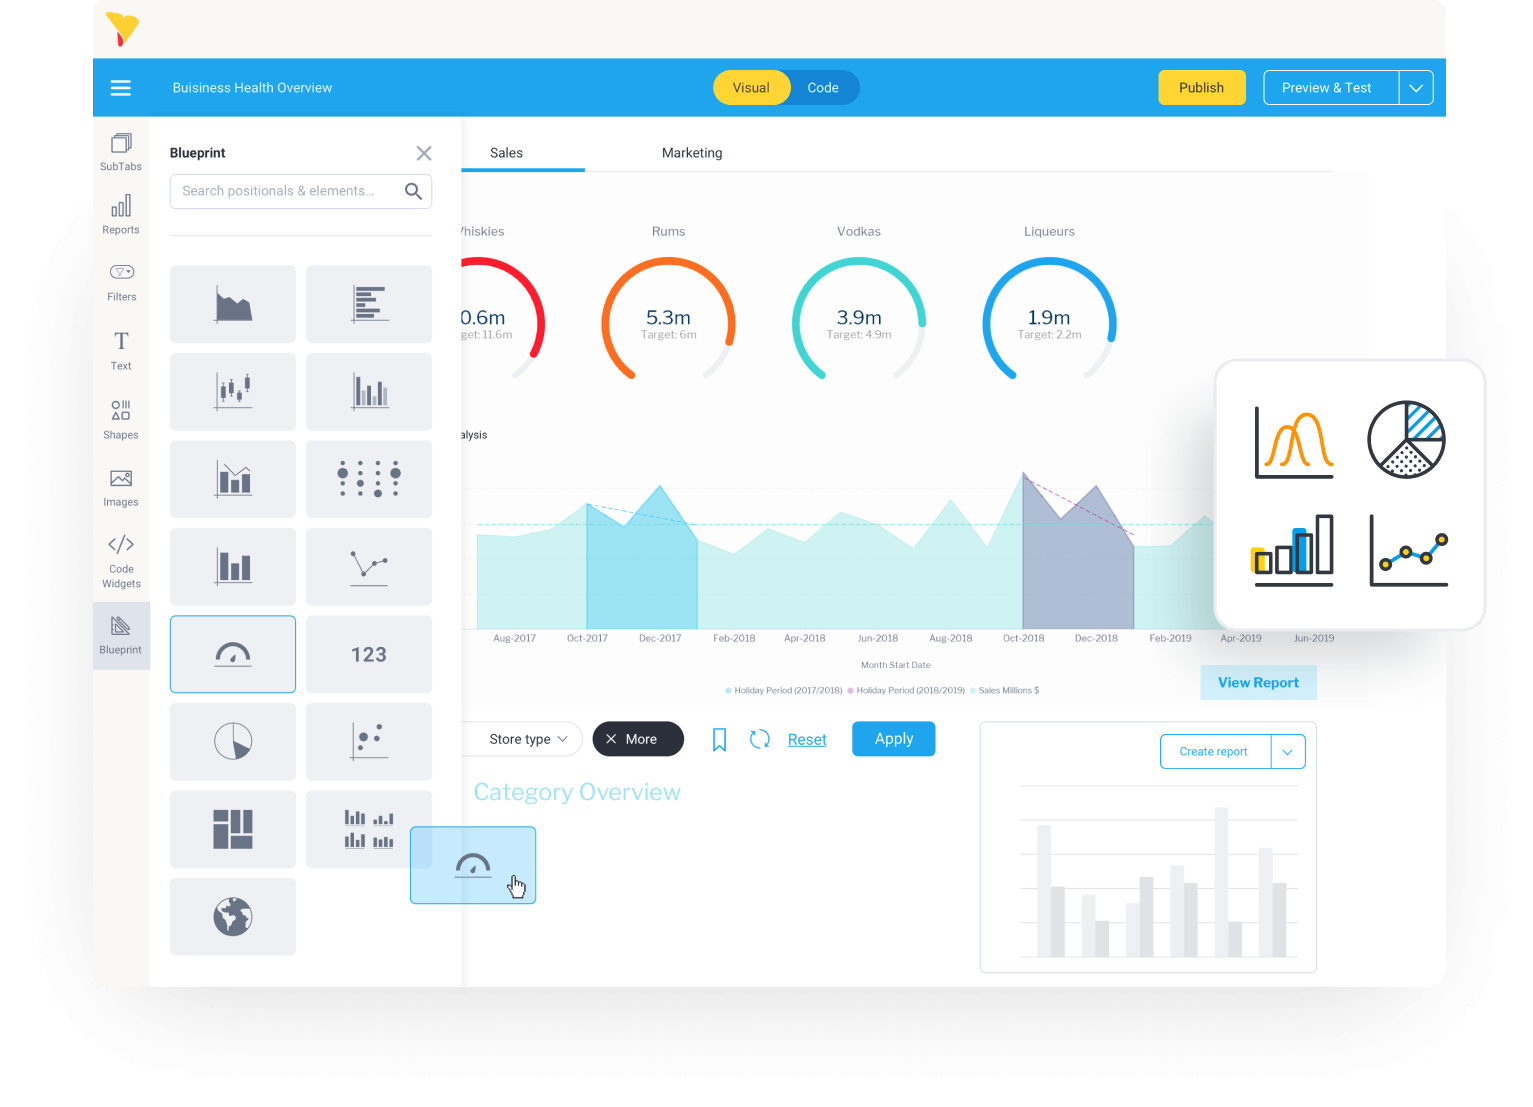
Yellowfin dashboards are flexible in both their creation and use compared to competitors such as Tableau. The Yellowfin design canvas comes in two forms - visual and code mode. Visual is a drag-and-drop, free-form user interface that allows users to freely customize and extend their dashboards with visualizations, rich media images, videos, icons, and reports generated by Yellowfin. Code mode is for advanced users wanting greater control.
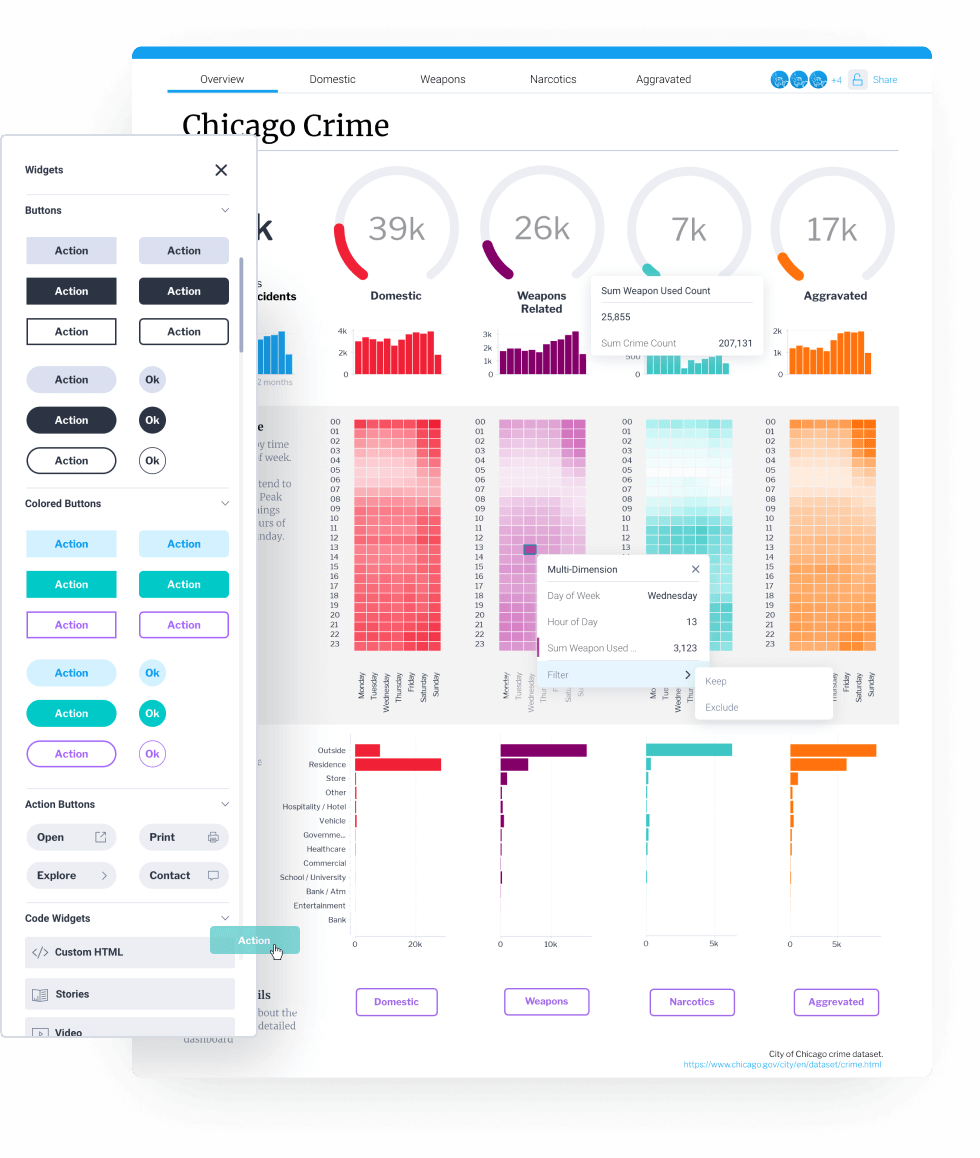
In both modes, you can input code widgets and action buttons for integration with other systems very easily, and set up your own actions when you press these action buttons - for example, you can call up the input screen of the business application you are using.
Most importantly, Yellowfin dashboard’s extensibility is backed by it being tailored for every type of user. Advanced users can take advantage of code widgets, and the drag and drop UI is streamlined for the use cases of the majority of line-of-business users.
Yellowfin is centered around providing a self-service BI experience for all users. The platform leverages sophisticated AI, automation, machine learning and natural language technologies to empower data experts and everyday business professionals to create, consume and share data insights, helping open up data-driven analysis and decision-making across the full organization.
In any grid or layout, users have total freedom to create engaging analytic experiences that go beyond the stock standard business dashboard template, and then augment it further with our rich data visualization library of over 50 chart types, as well as our automation and data storytelling features of Guided NLQ and Yellowfin Stories and Present, respectively.
Many of our customers who use Tableau have noted the daunting user interface and steep learning curve to begin implementing basic visualizations, as well as the limited ability to customize visualizations in comparison with Yellowfin, and its limitations in having to use the Desktop tool for more advanced content creation. Much of its focus is also on its SalesForce integration, which may or may not benefit the line-of-business dashboard user wanting to get the most of their exploration and creation of compelling reports using its existing analytics and visualization tools.
4) Multilingual development
Yellowfin provides great flexibility for multi-language implementations. The platform allows you to set up a content translation file for each of the reports that make up the dashboard, and if a translation is set up, it will check the browser's language settings and automatically display the dashboard in that language. Elements such as chart labels, column titles and report names are supported using this content translation support.
In comparison, Tableau is criticized for its lack of support for more languages by its user-base. It does currently provide its own localization feature in Desktop and Server to support users in different locales.
5) Flexible Business Model
Yellowfin has long been a Pioneer in BI OEM and ISV use cases, and provides flexible business models that can be customized using multiple parameters, from unit pricing to revenue share.
Most other BI vendors limit ISV use cases based on capacity and separate between access right for Embedded use and Core Analytics platform use. For example, Tableau has several ISV tiers that are based on the size of the underlying databases, and only the highest tier allows both embedded and analytics usage. Their tiers also limit the number of connectors for each tier.
Yellowfin as a platform is able to be white labeled for ISV usage and the value based pricing model gives ultimate flexibility to align pricing with ISV business outcomes, such as user adoption or revenue.

Yellowfin vs Tableau: What's the difference?
Learn how Yellowfin can provide better embedded analytics experiences for your unique use cases than its competitors - try our demo for yourself today.