
What's new in Yellowfin 9.2
See how Yellowfin 9.2 provides business users with unique ways to engage with and act on their data, and addresses the needs of data analysts and developers who want to build and deploy amazing analytical experiences.

See how Yellowfin 9.2 provides business users with unique ways to engage with and act on their data, and addresses the needs of data analysts and developers who want to build and deploy amazing analytical experiences.

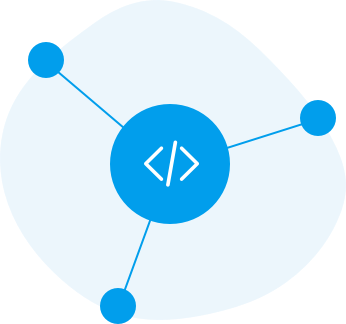
Embed and extend with the same APIs

Automate unique data experiences
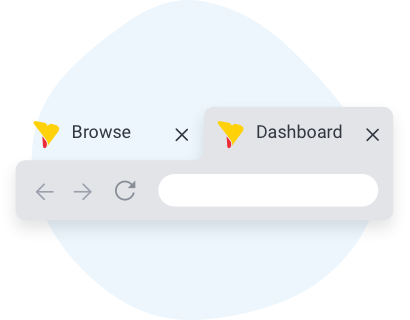
Do more across multiple browser tabs and windows
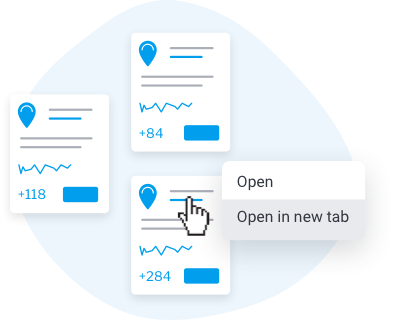
Open content into multiple browser tabs
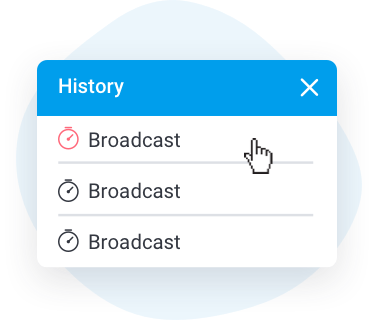
Keep track of every run
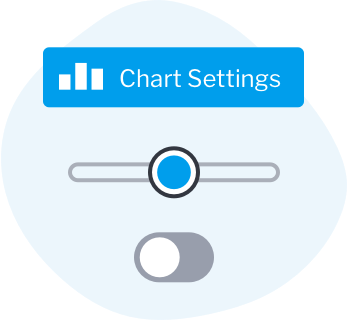
Do it once for all charts
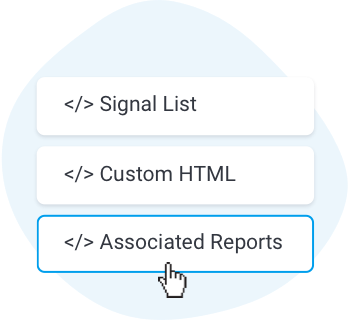
Associated reports list gets a revamp
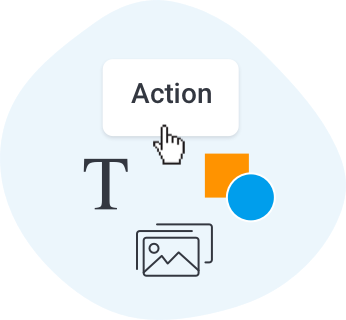
Every widget is now actionable
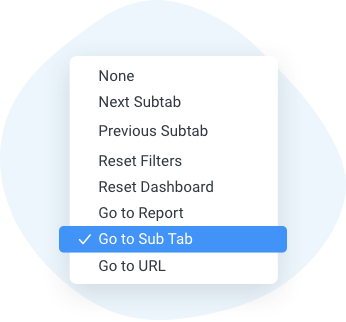
Additional events for dashboard actions
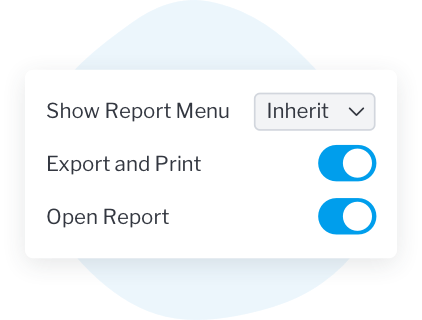
Decide when widget menus should appear
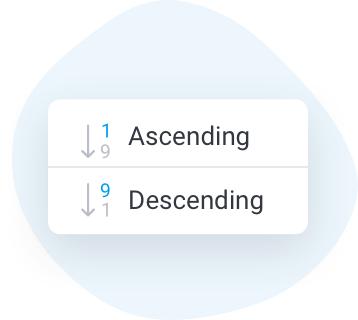
Flexibly sort your dashboard metrics
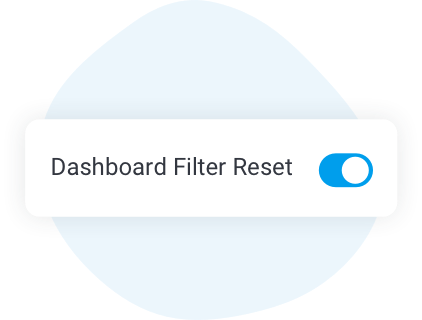
Increased control over dashboard filter resets
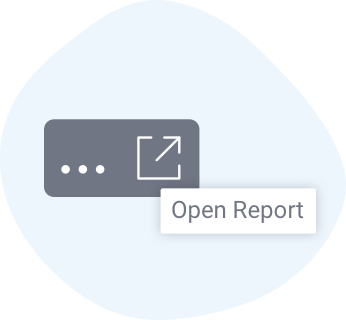
Retain context when opening reports from dashboards
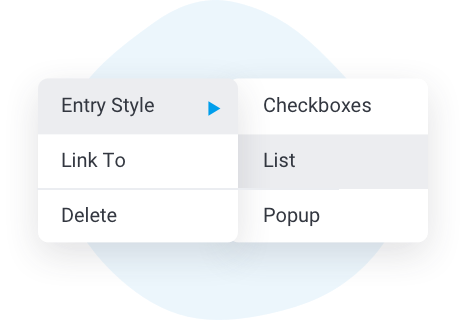
Do more with your dashboard filters
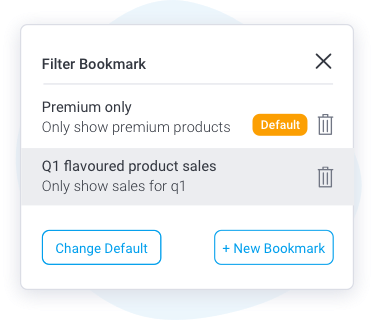
Save your favorite combinations and navigate to them quickly
Your dashboards and presentations without distractions
Additional options for managing Presentations
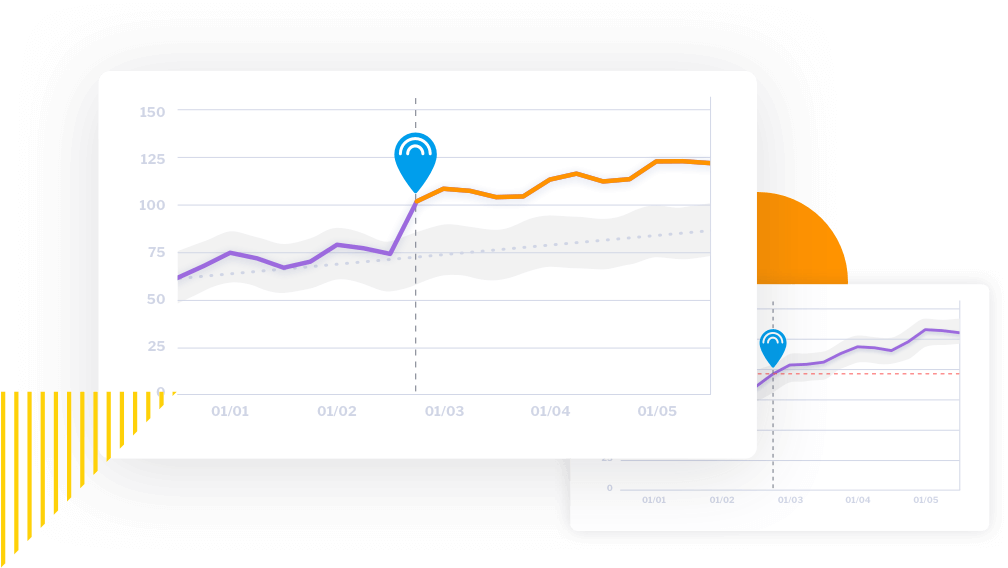
Be alerted to underlying shifts in your data
Schedule and distribute reports to any server
Describe what your derived fields mean
Define what it is upfront
Ensuring everyone sees data
Quicker edits within reach
Let us help you find out who didn’t get it
Increased control over report performance
The new JavaScript API becomes generally available. Rich in features, the API contains an updated user interface and a richer set of functions and events. You can use the same JavaScript API when embedding Yellowfin content or within Yellowfin in Dashboard Code Mode.
The new REST API provides you the support to automate back-end processes, perform administrative tasks and manage content programmatically. Importantly, the REST API also provides access to Yellowfin content for developers, enabling them to build custom turn-key experiences incorporating Yellowfin Signals, Stories, Notifications and more.
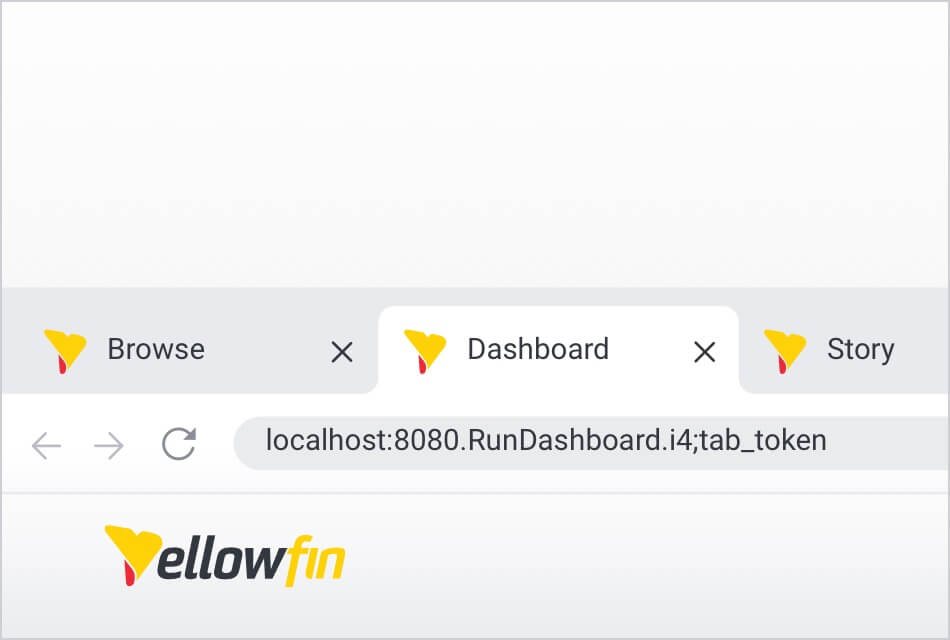
New configuration functionality has been added to allow you to use Yellowfin across multiple tabs or windows of the same browser. As part of this enhancement, safety checks have been put into place to protect against data corruption and prevents the same content from being edited in multiple tabs concurrently.
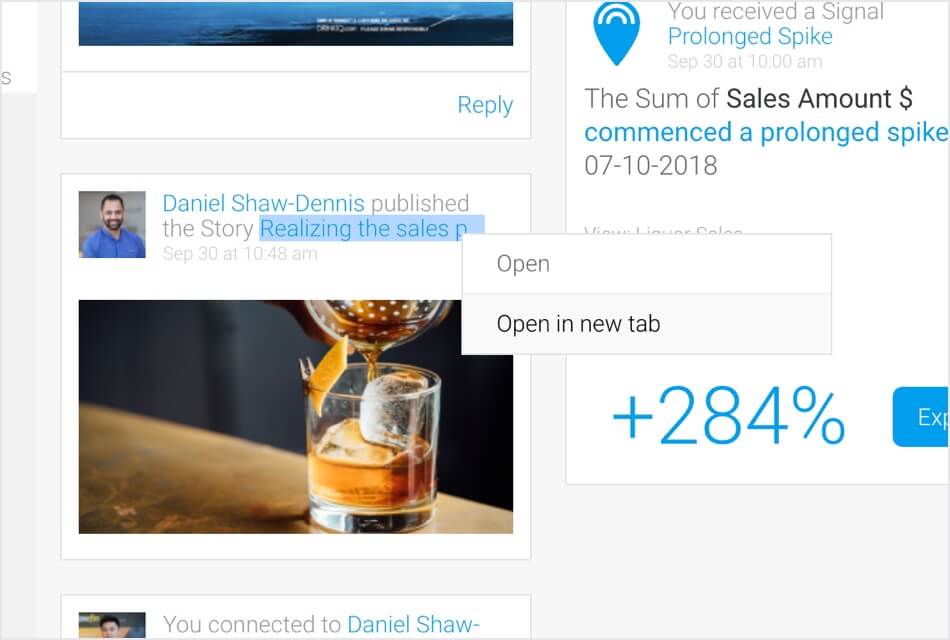
Timeline event cards that mention analytic content or contain links now have a menu icon. This menu offers you options to open the content in the same or separate browser tabs.
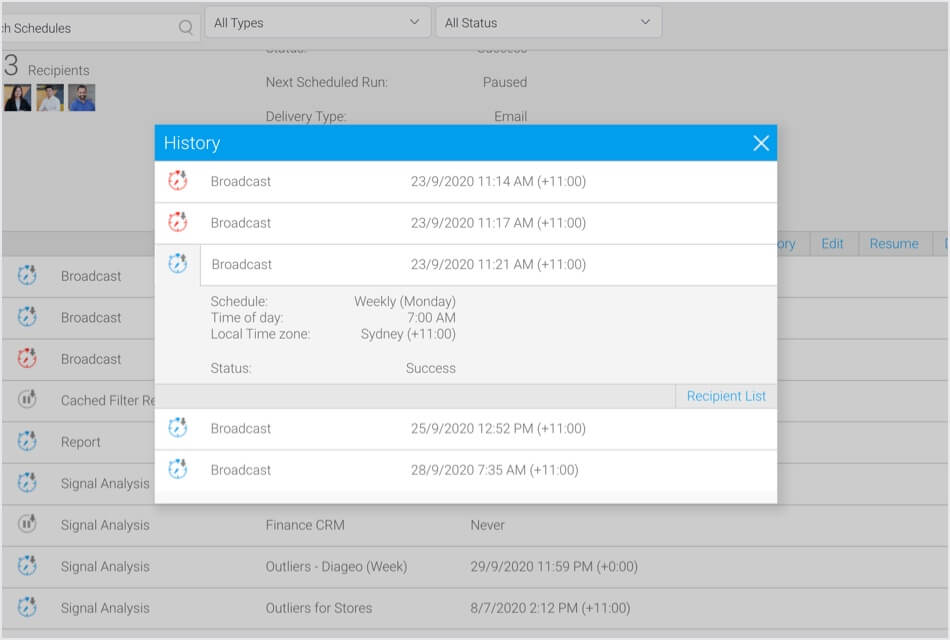
You can now view every historic run of scheduled tasks within the Schedule Management page.
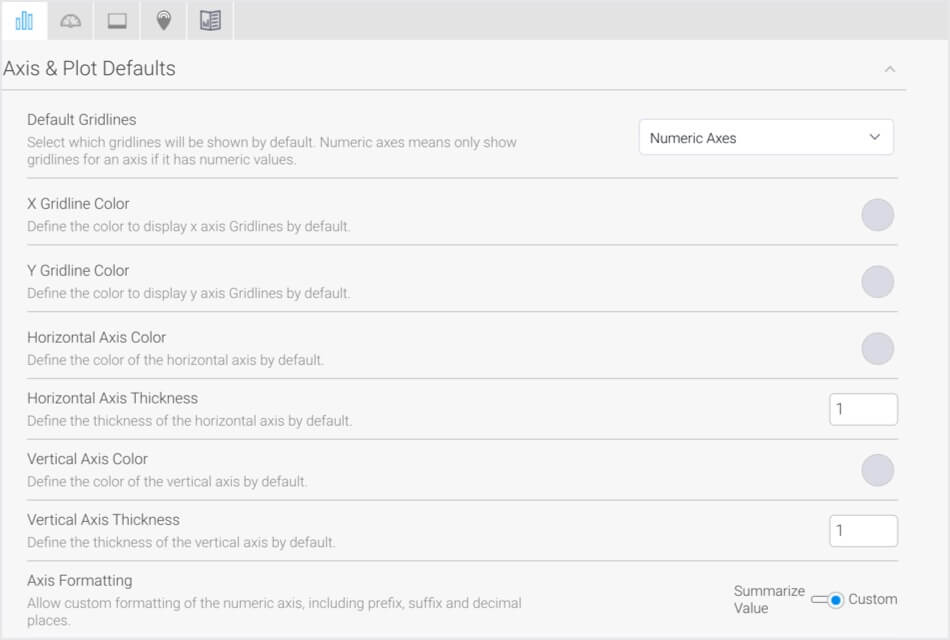
You can now specify the Axis Formatting column setting for charts at the admin configuration level. As part of this enhancement, you can choose if numeric axis units will be summarized or define custom formatting. This setting will be applied in charts if Axis Formatting is set to ‘Default’.
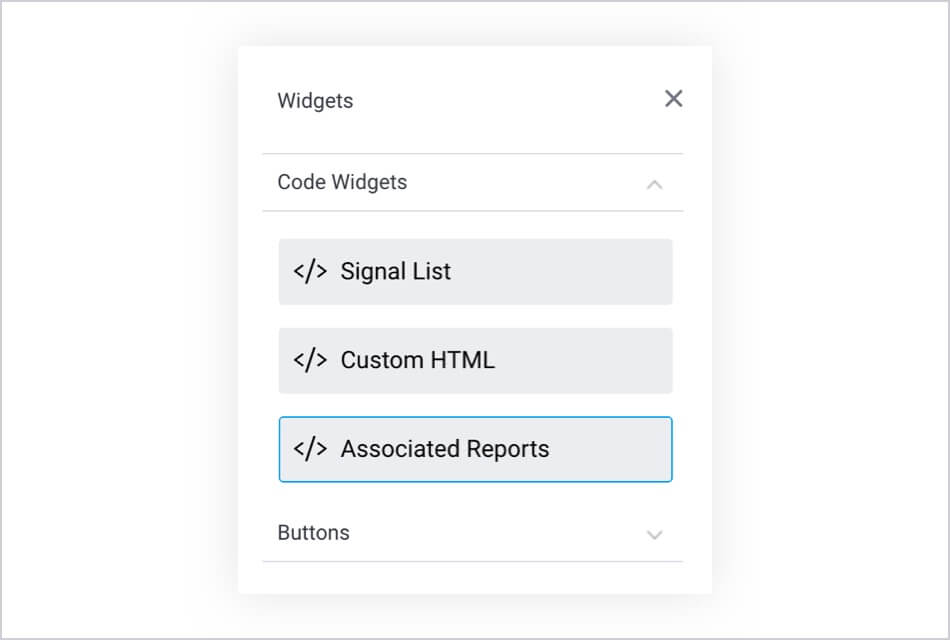
Associated Reports functionality has been refreshed for Dashboards. You can now add reports as links in your dashboards rather displaying full reports, into both canvas and global containers.
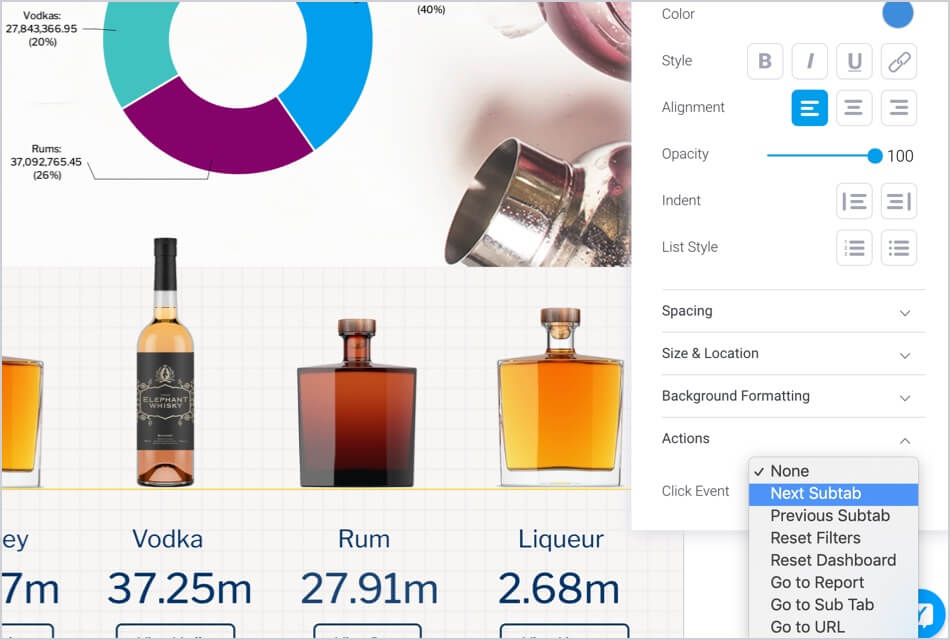
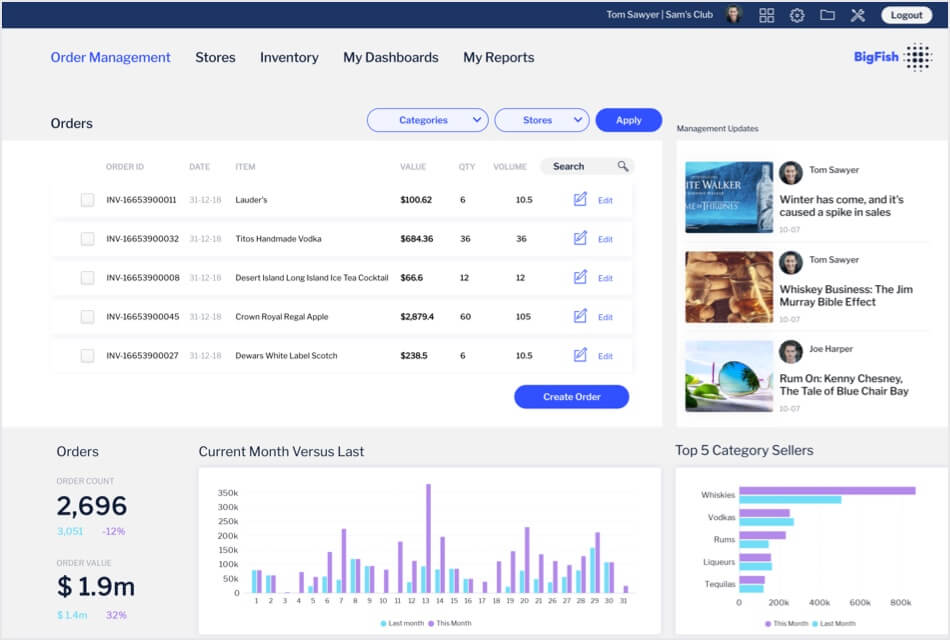
Action Button functionality has been added to every dashboard canvas widget, making any dashboard widget actionable — meaning an event can be triggered when a widget is clicked. The types of events include: navigating to specific sub tabs, resetting dashboards or filters, jumping to a report or even an external link.
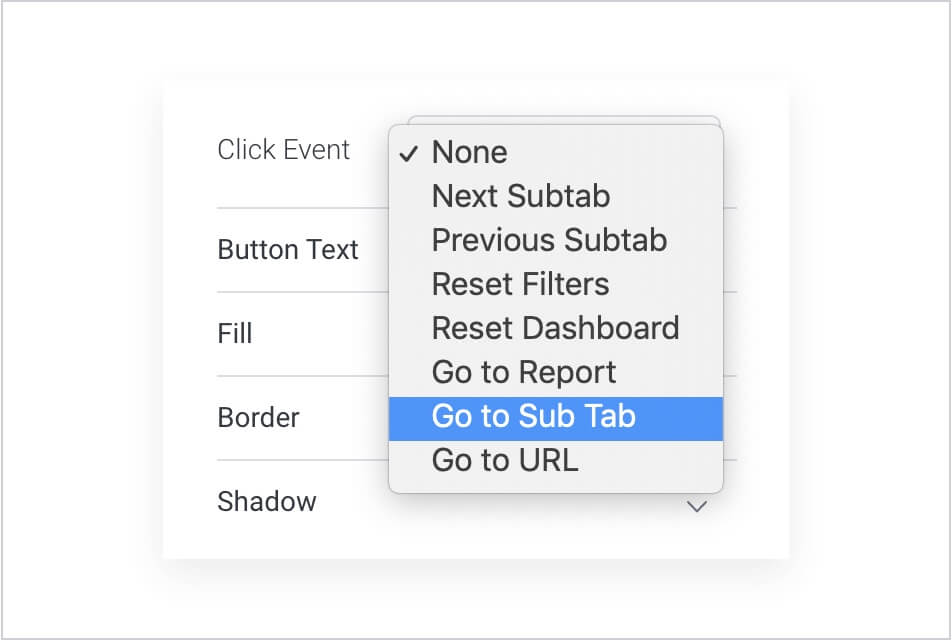
New events have been introduced for action buttons and all other dashboard widgets. These include: ‘Go to URL’ that navigates to an external page, and ‘Go to Sub Tab’ that navigates to any sub tab or slide within dashboards and presentations respectively.
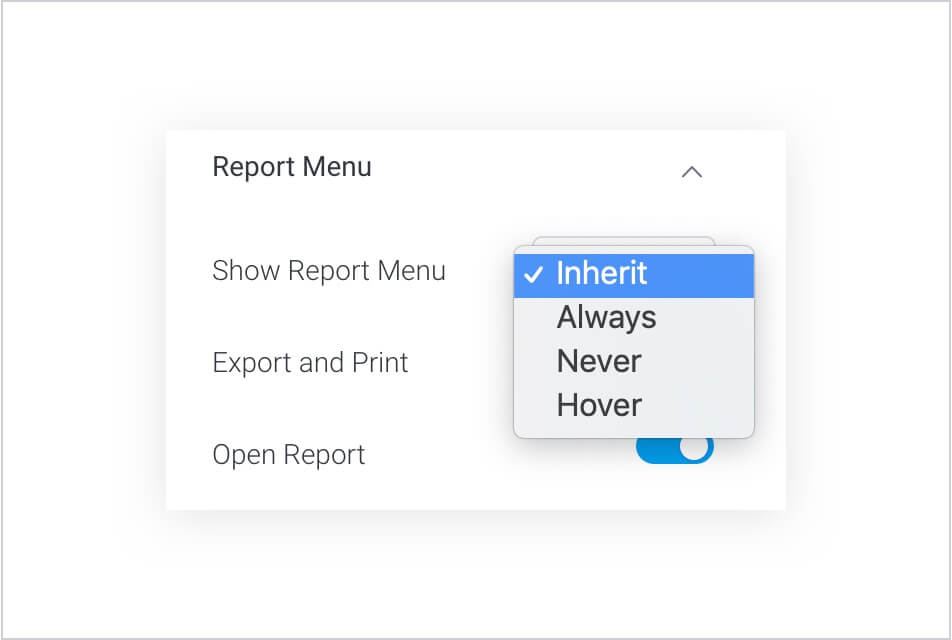
New settings have been added to control the visibility of widget menus. These can be set to always show the menus, never show them, or only show them when a user hovers on them.
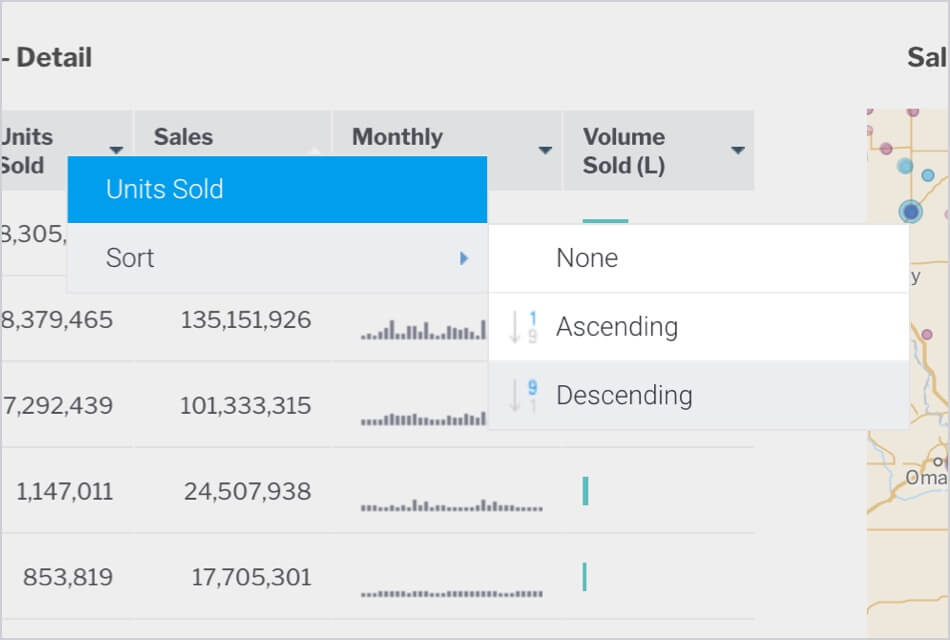
Tabular report columns can now be sorted in ascending or descending order on published dashboards.
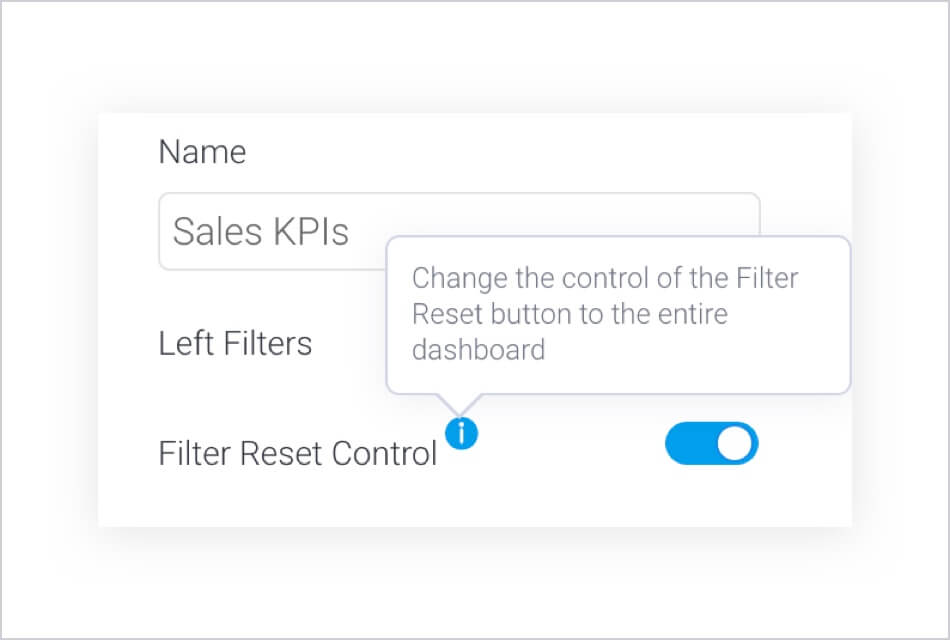
The reset button for dashboard filters can now be toggled to either reset filters only or all dashboard interactions including drills, sorting, chart brushing, date sliders and series selections.
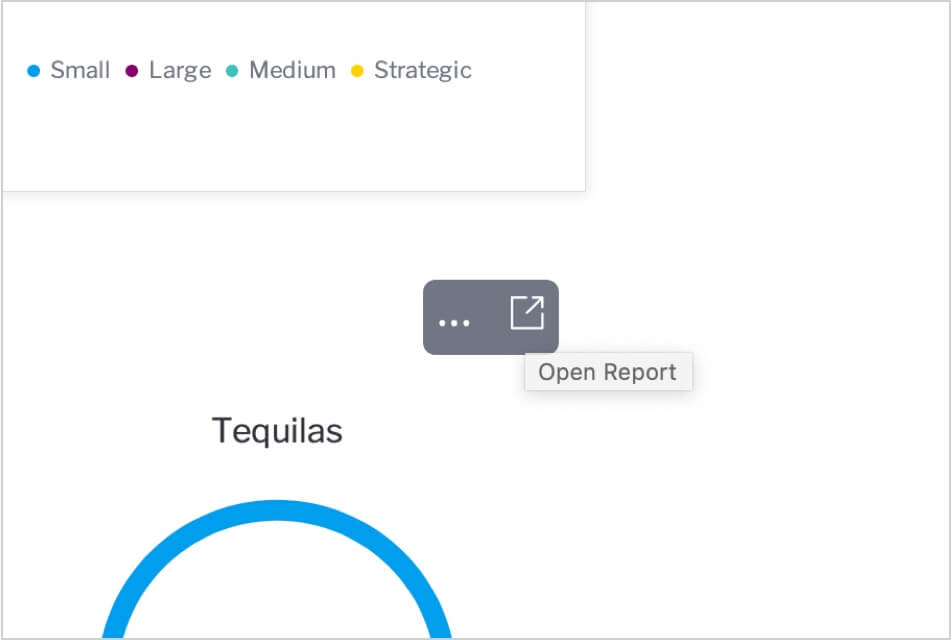
Filter values applied on a dashboard are retained when opening a report from it. Improvements here include new navigational buttons to return you to the dashboard in a single click.
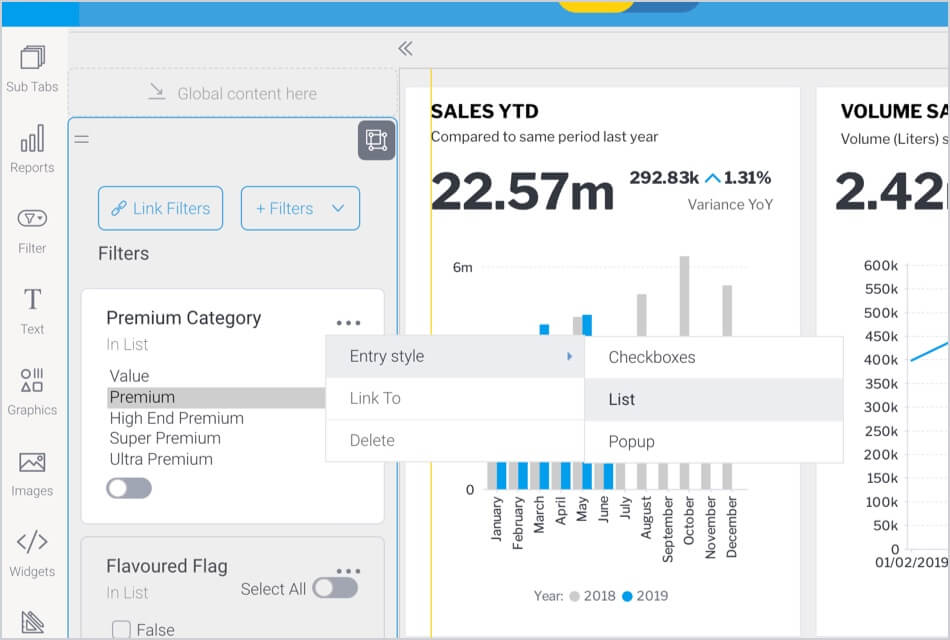
You can now change the display style of filters within a dashboard. This allows the entry style to be changed to checkboxes, lists, pop ups, dropdowns or radio buttons.
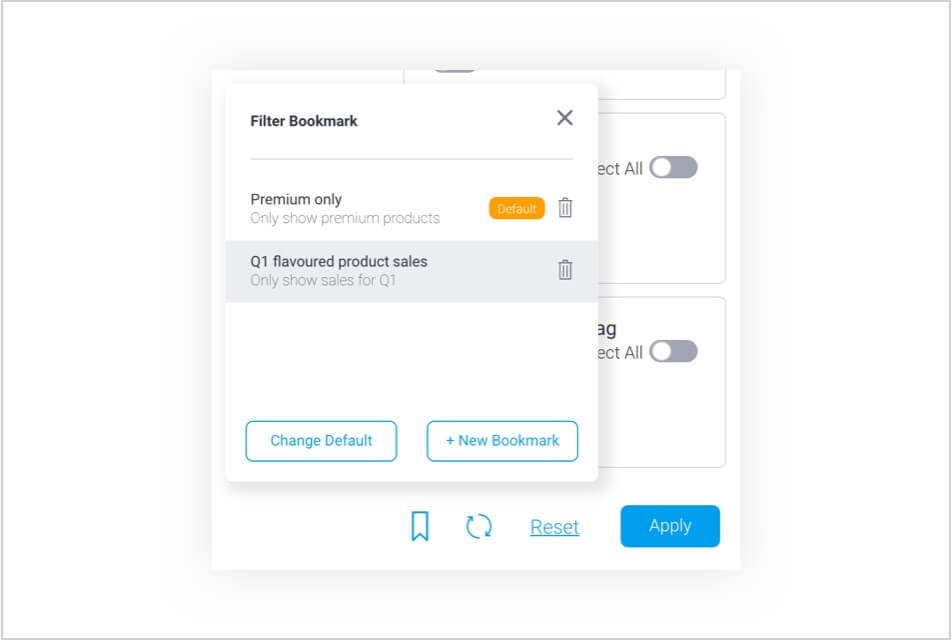
You can now save personalized default filter bookmarks that will automatically be applied to the dashboard when first loaded, or if the filters are reset.
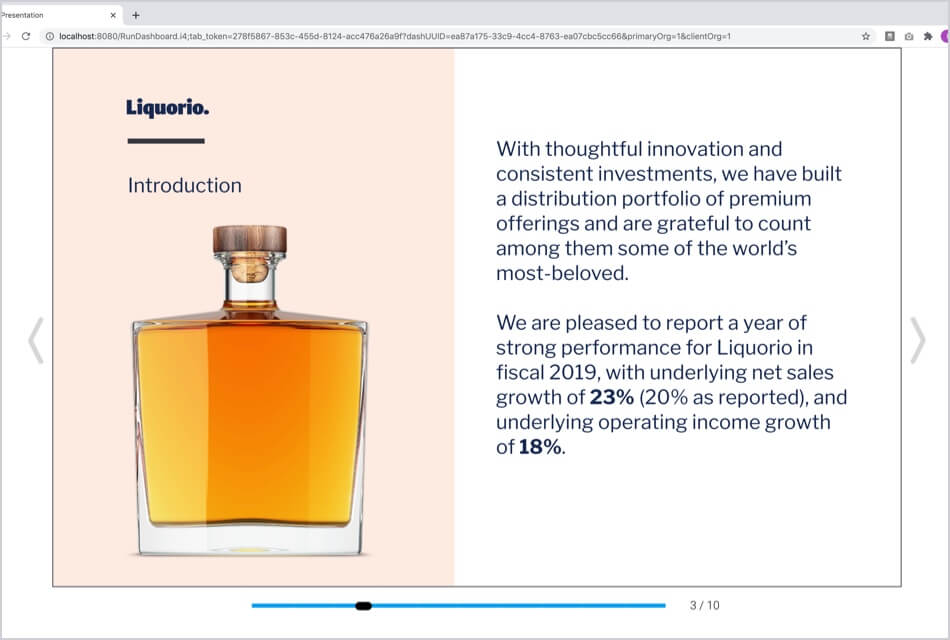
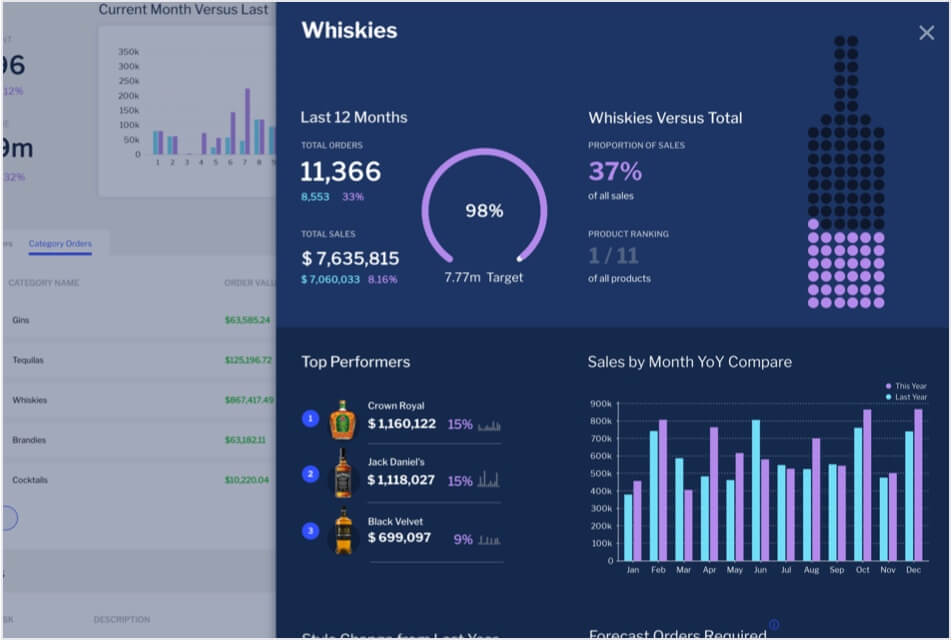
Published Dashboards and Presentations can now be opened in full screens — showing just the content and hiding all toolbars.
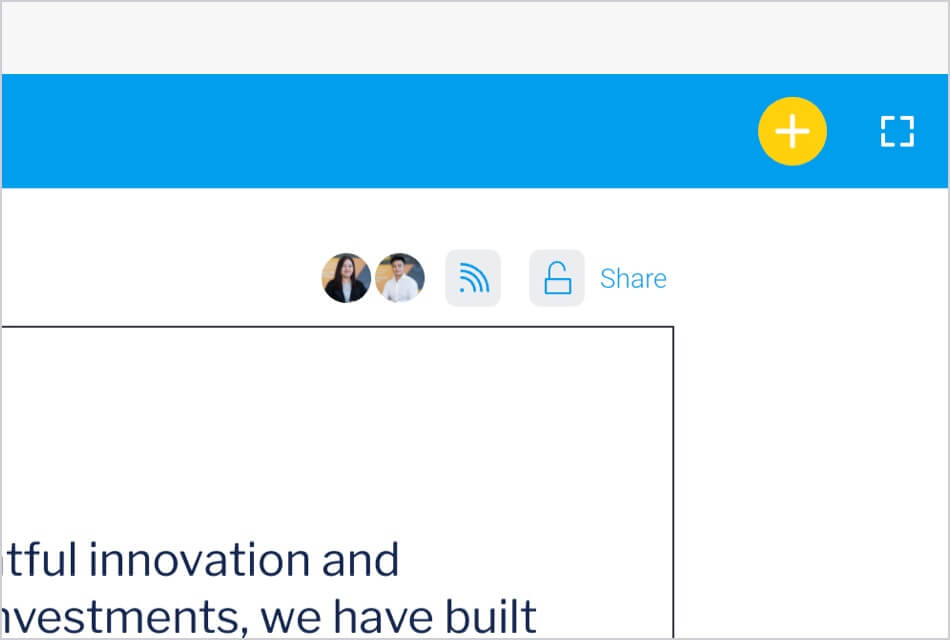
A new toolbar has been added to published Presentations, showing presentation viewers including allowing you to configure user access and share the presentation.
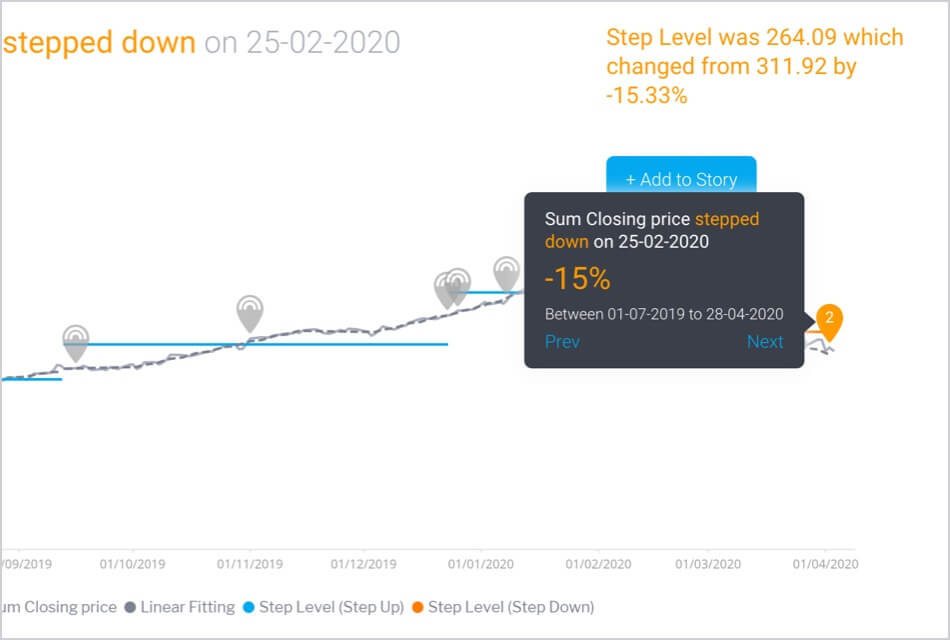
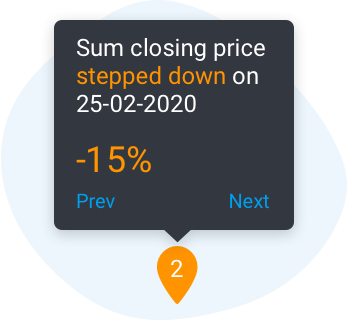
Step Change Signals are now generally available within the outliers detection group for Signals.
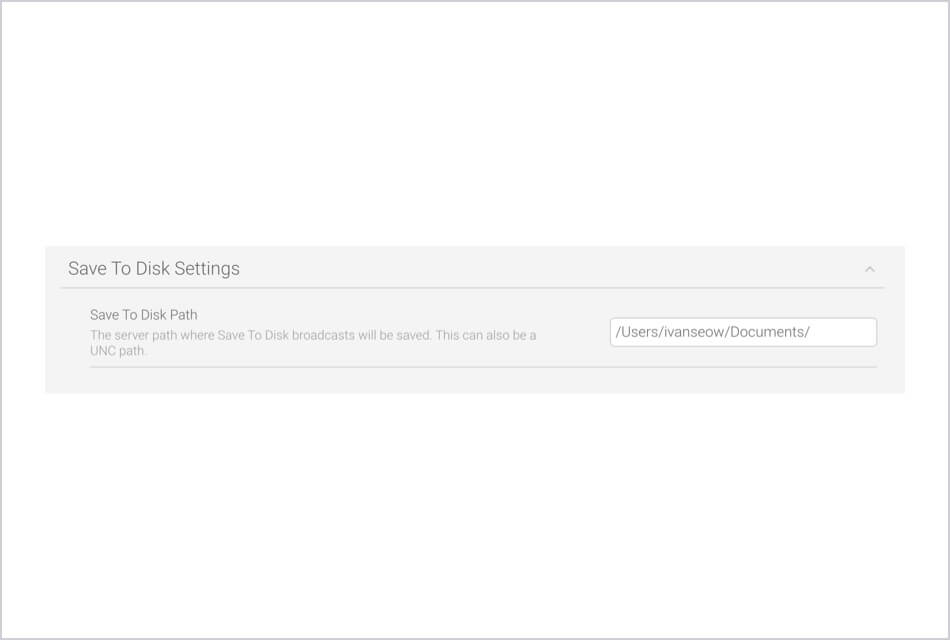
A new Broadcast schedule type, ‘Save to Disk’, has been introduced, allowing you to schedule reports to be saved onto a local server path.
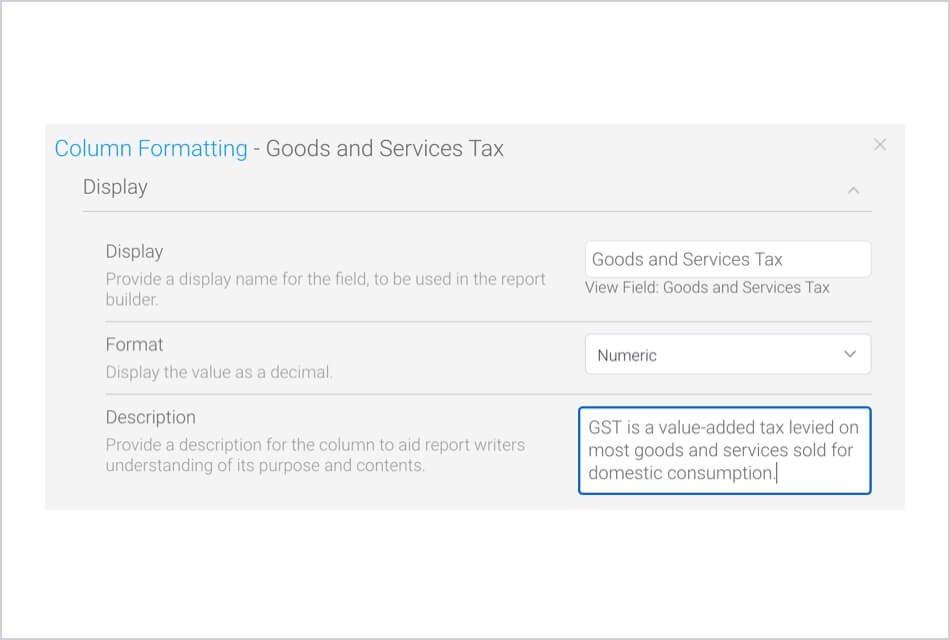
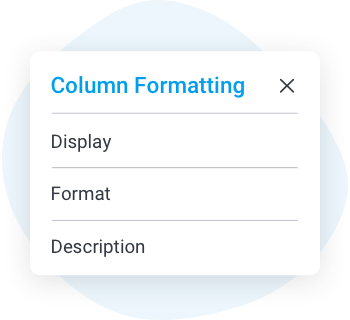
A new column formatting setting has been provided for calculated fields that allows you to clearly describe the field’s purpose and content to aid report authors.
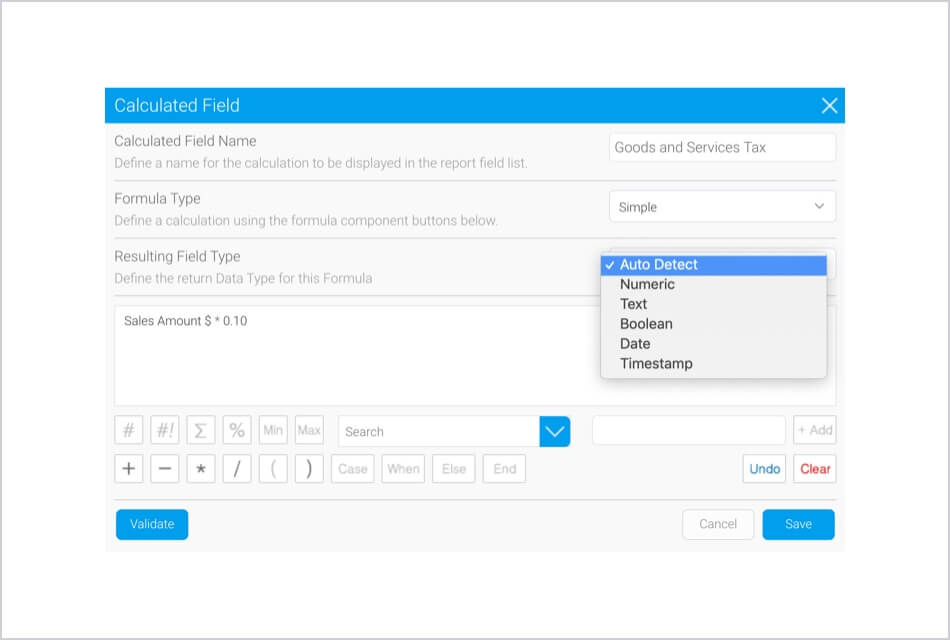
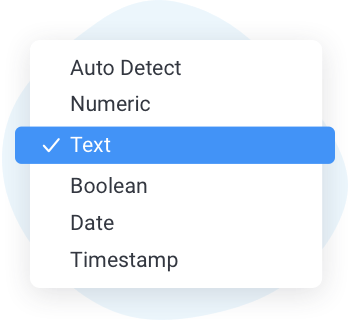
You can now define the datatype of a calculated field’s resulting column upfront such as Numeric, Boolean, Text or Date. As part of this enhancement, the engine will not perform a validation test. The option to allow the engine to determine the datatype is also still possible by choosing the Auto Detect option.
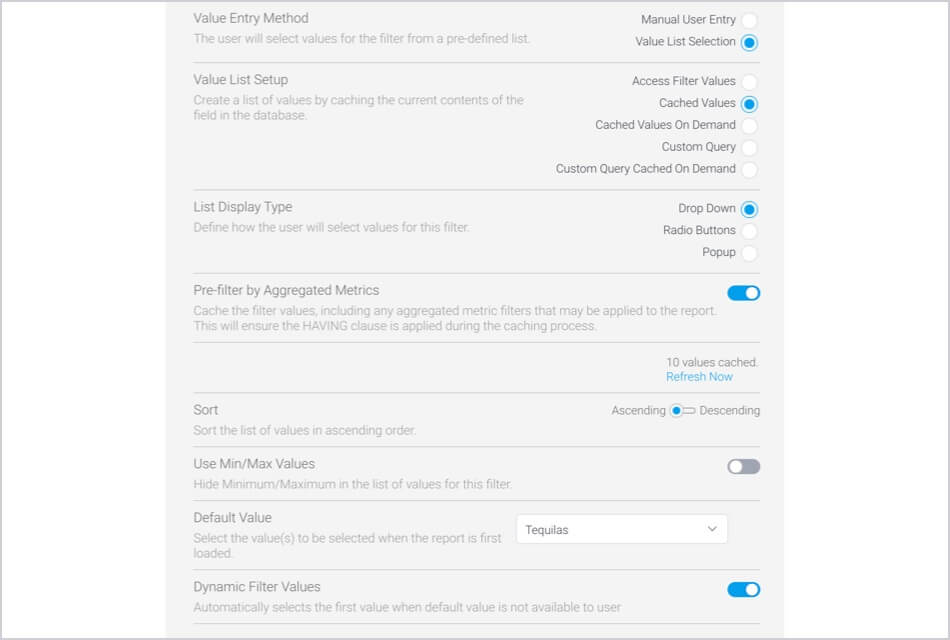
A new setting has been introduced for dimension filters in reports where the first accessible value is automatically selected if you do not have access to the default value — particularly useful for scenarios where access filter restrictions are applied.
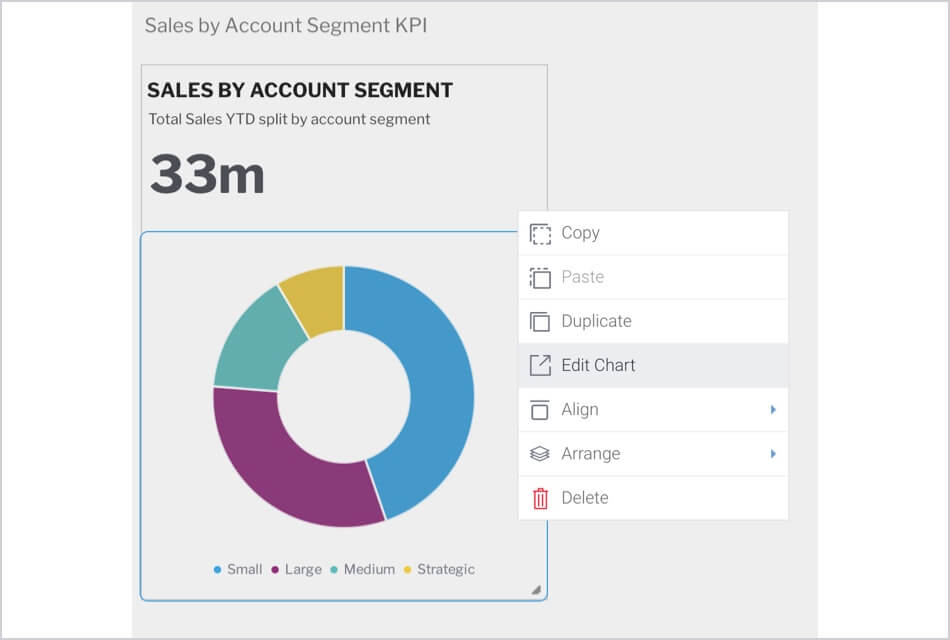
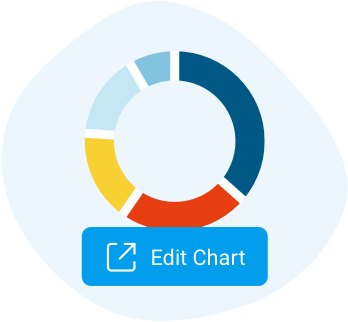
You can now edit a specific chart from a report’s design canvas with a single click.
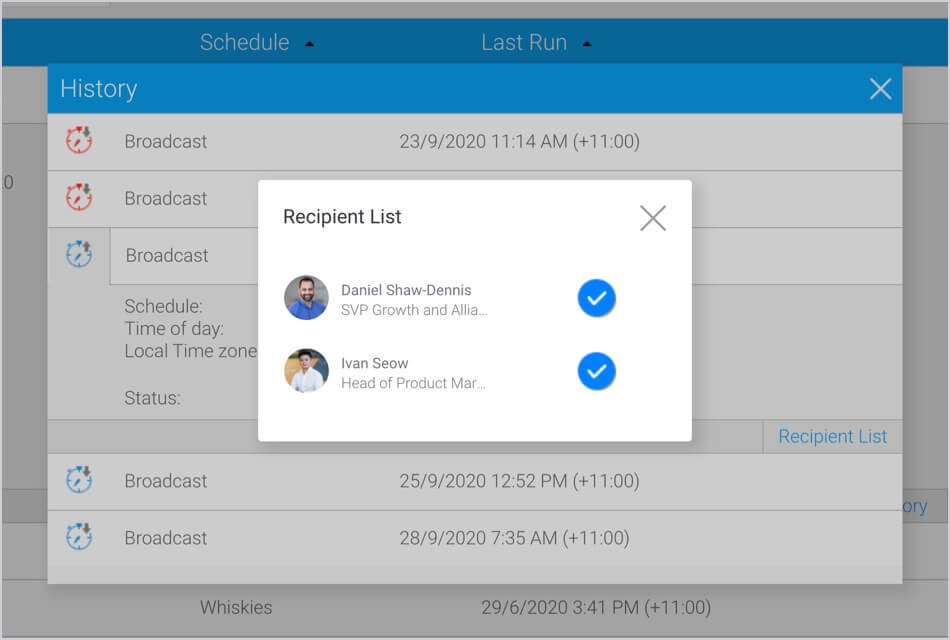
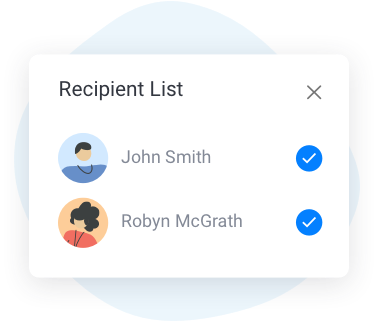
Scheduled tasks that deliver content, such as report broadcasts, now maintain a list of recipients. Each historic run tracks users who successfully received the content and who did not. It is also possible to view the error in case of a failed delivery.
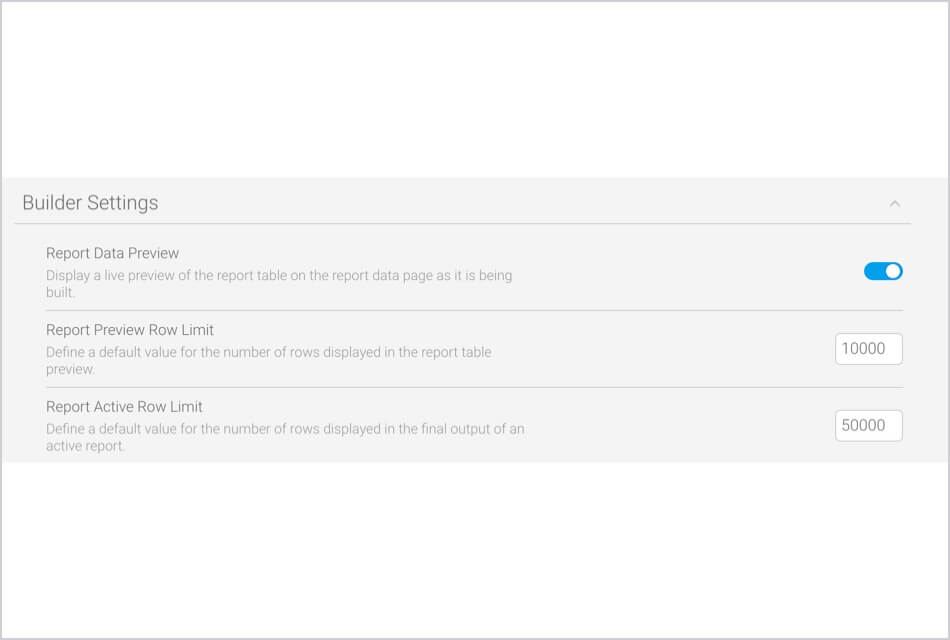
New configuration options now allow you to define global default limits for the number of rows to preview data as it is being built within the report builder and the number of resulting rows returned in active reports. As part of this enhancement, these settings apply to all reports but can also be changed at the individual report level.

Learn more about features in previous Yellowfin releases.

Download the latest Yellowfin release and see the full list of what’s changed.

Get started and learn everything Yellowfin has to offer.

Connect with people just like you in our community.

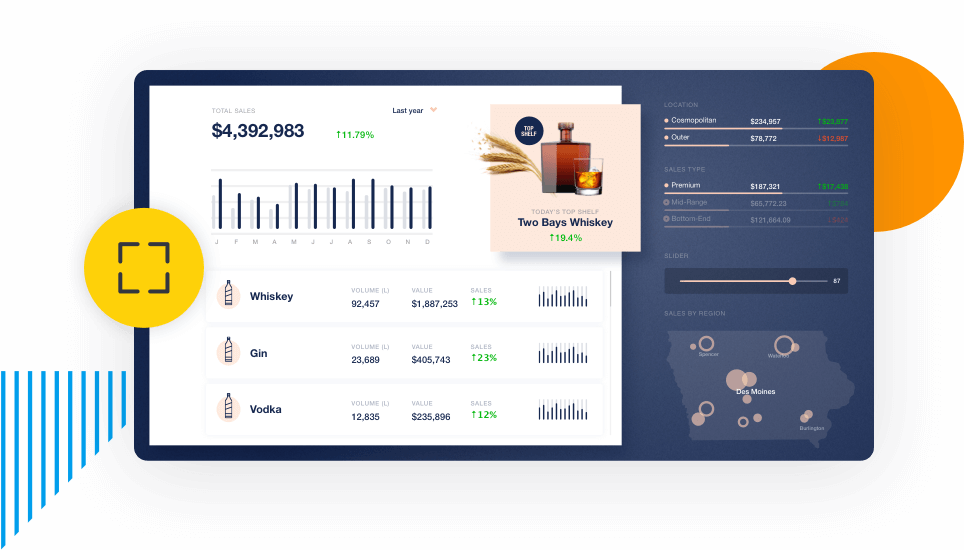
Let us show you the best analytics product on the market with the only analytics platform that combines action based dashboards, automated business monitoring and data storytelling capability.