
What's new in Yellowfin 9.3
See how Yellowfin 9.3 provides business users with unique ways to engage with and act on their data, and addresses the needs of data analysts and developers who want to build and deploy amazing analytical experiences.

See how Yellowfin 9.3 provides business users with unique ways to engage with and act on their data, and addresses the needs of data analysts and developers who want to build and deploy amazing analytical experiences.

Schedule and distribute dashboards to your entire organization
Drop images directly onto the canvas
Text writing gets a makeover
Powerful image management
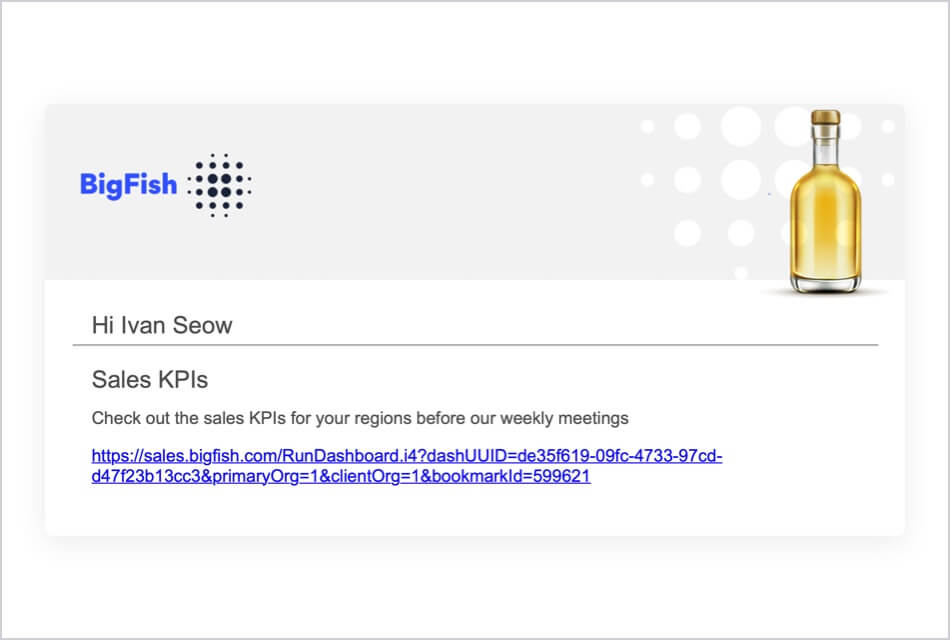
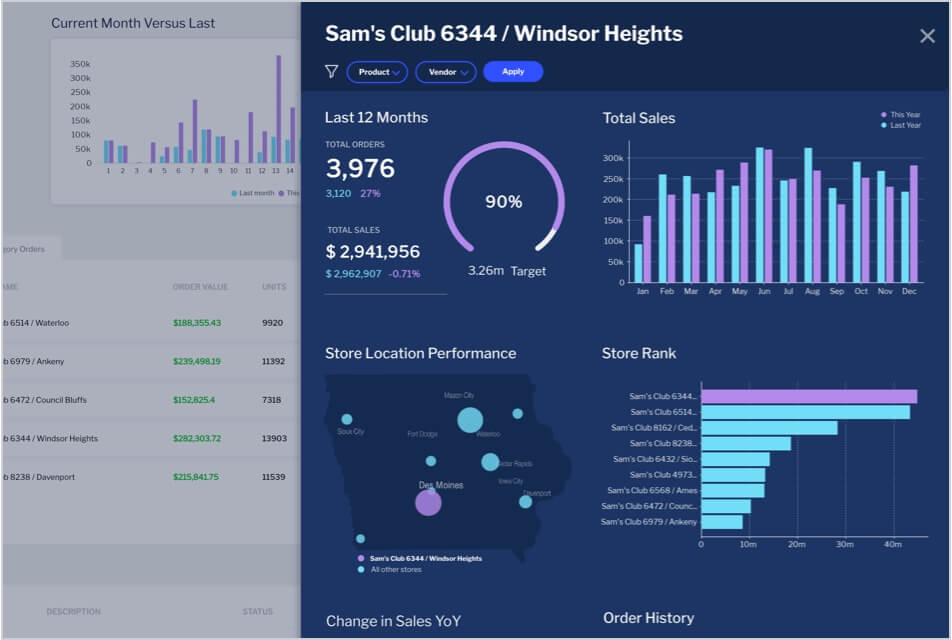
Bring your dashboard filter bookmarks anywhere
Render your pixel-perfect dashboards into PDF
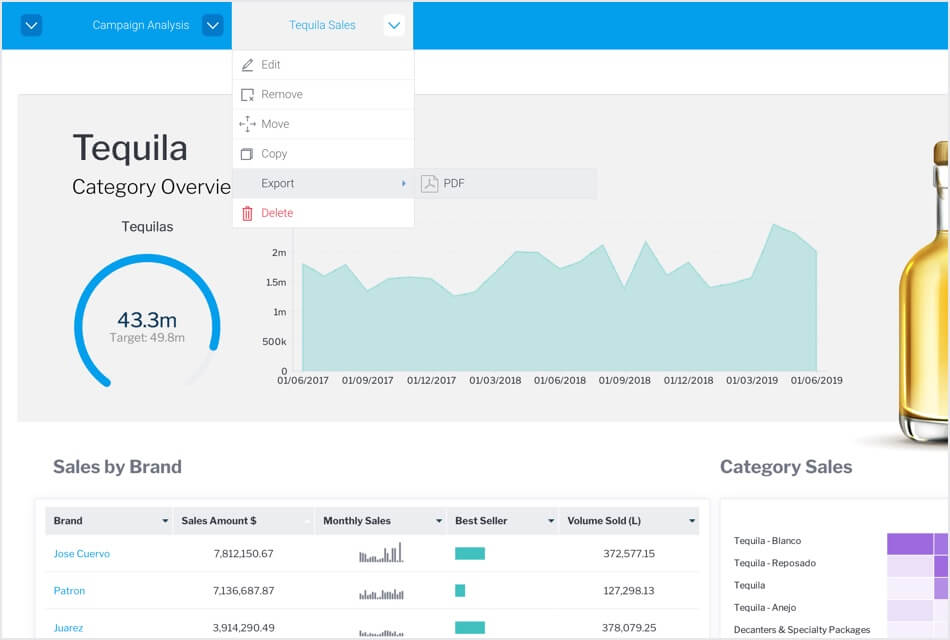
Better menus within reach
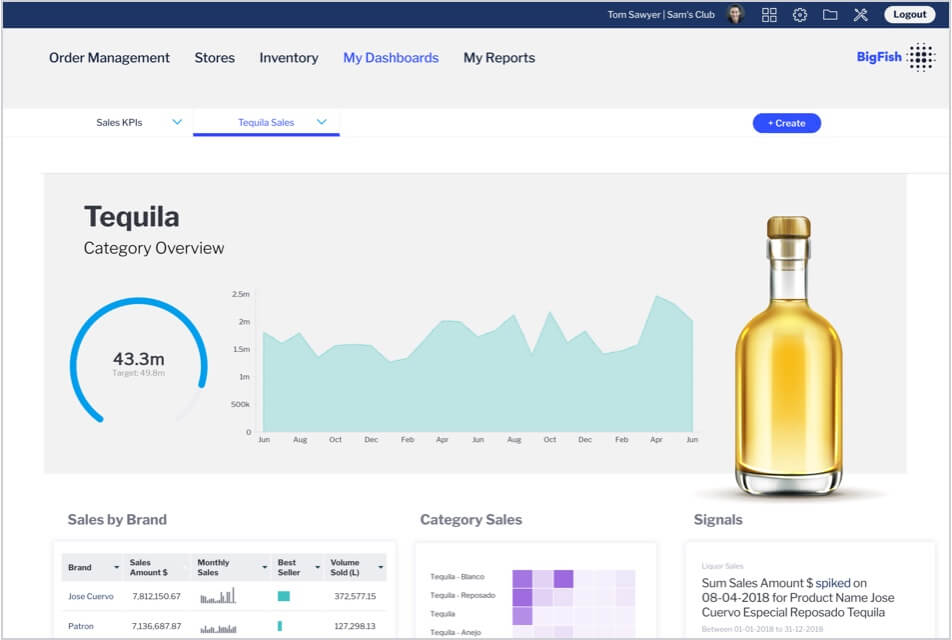
Utilize AI in your embedded dashboards
Let us help you align those KPIs
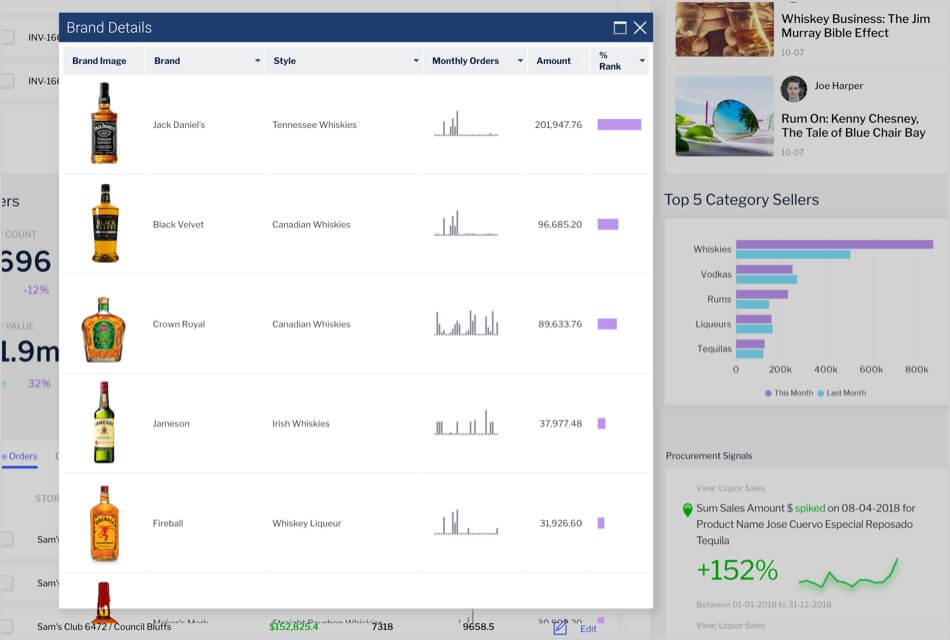
Display visual images within your tabular reports
Left, right, top, bottom. Your choice.
Trim and color at the same time
Build dynamic narratives for your charts
Additional drill options for more use cases
Show / Hide minimum and maximum values in your filters
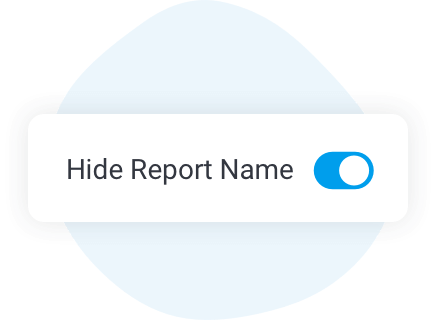
Increased control over report names on dashboards
Do more with your embedded analytics
Create and load content the way you want, faster
Faster white-labelling across the suite
Smoother upgrades with zero-downtime
Increased control over administration, users and content
Every client organization gets their own branded broadcasting link
Making audits and activity tracking simple
Localize the display of your metrics
Apply password expiration best practice
Blend different approaches for embedded analytics
Additional options for Single Sign On
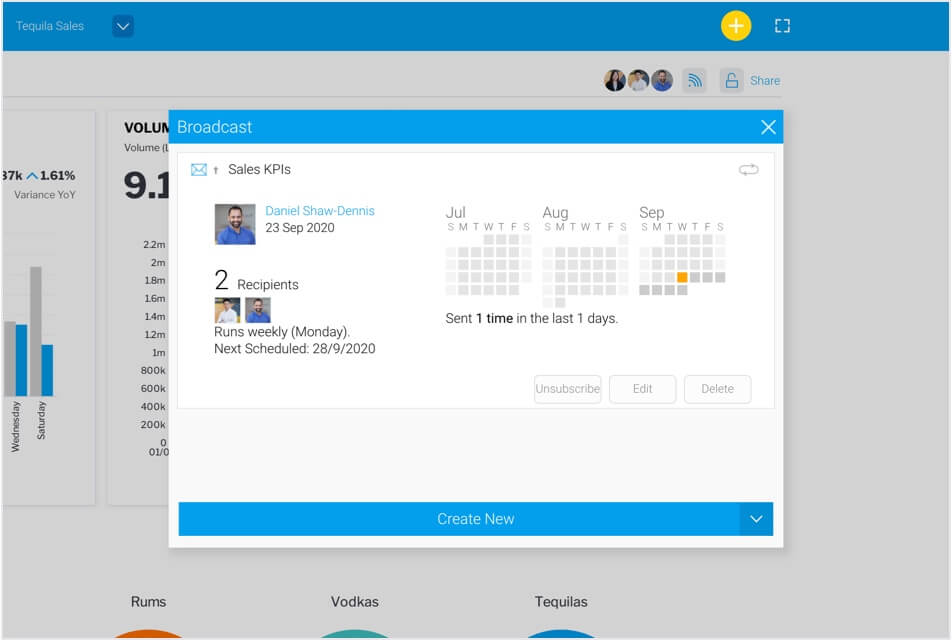
Just like reports, you can now schedule and broadcast dashboards as a link or PDF. Improvements include additional options for scheduling granularity.
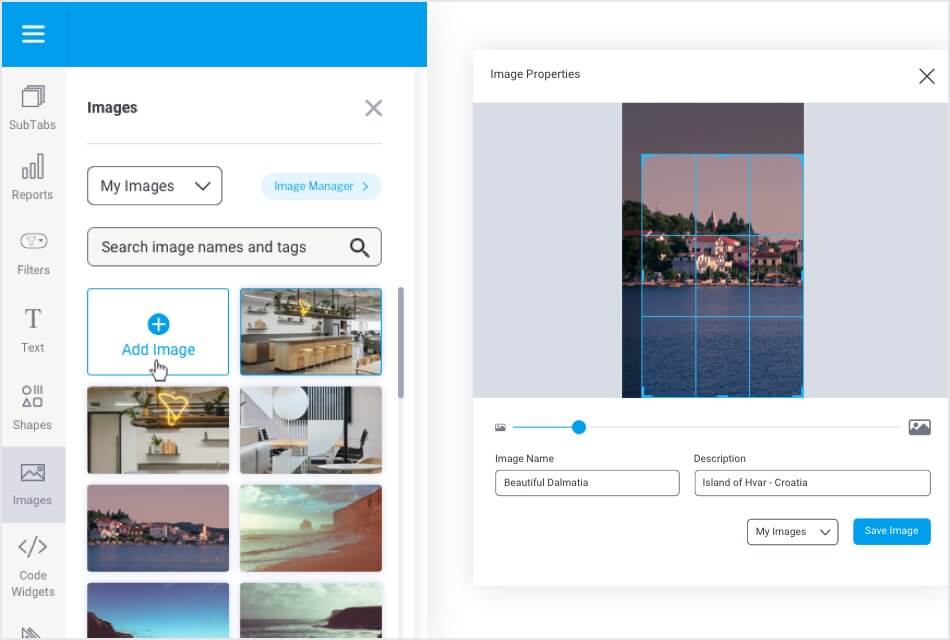
You can now search for images and add them directly onto the dashboard. Images on the canvas can also be replaced in-line while retaining widget properties including opacity, positioning, dimensions and more.
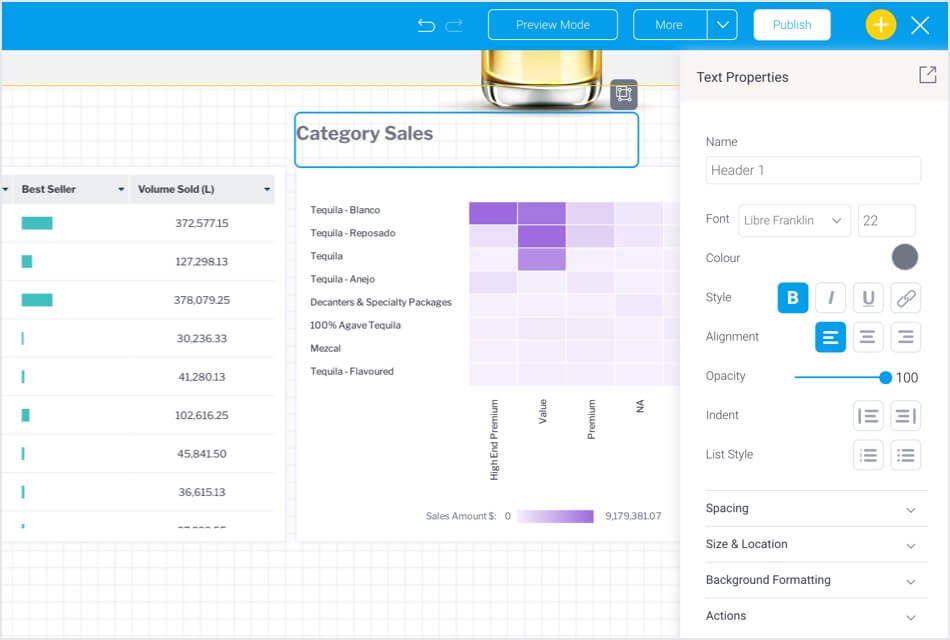
Text Widgets have been refreshed with a new inline text editor, providing a much smoother experience for editing and formatting text. Improvements include new keyboard shortcuts for quicker edits.
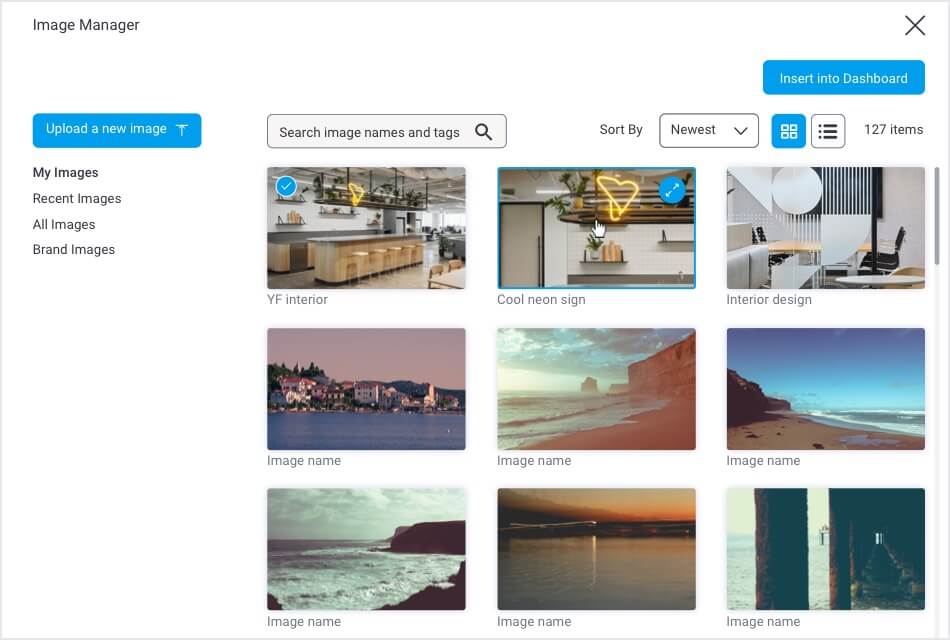
A brand new image manager with improved search performance now allows you to apply new sorting options (newest, oldest, alphabetical) and also search for your uploaded images only. Improvements include the ability to tag uploaded images as corporate images which are only visible to users with appropriate roles.
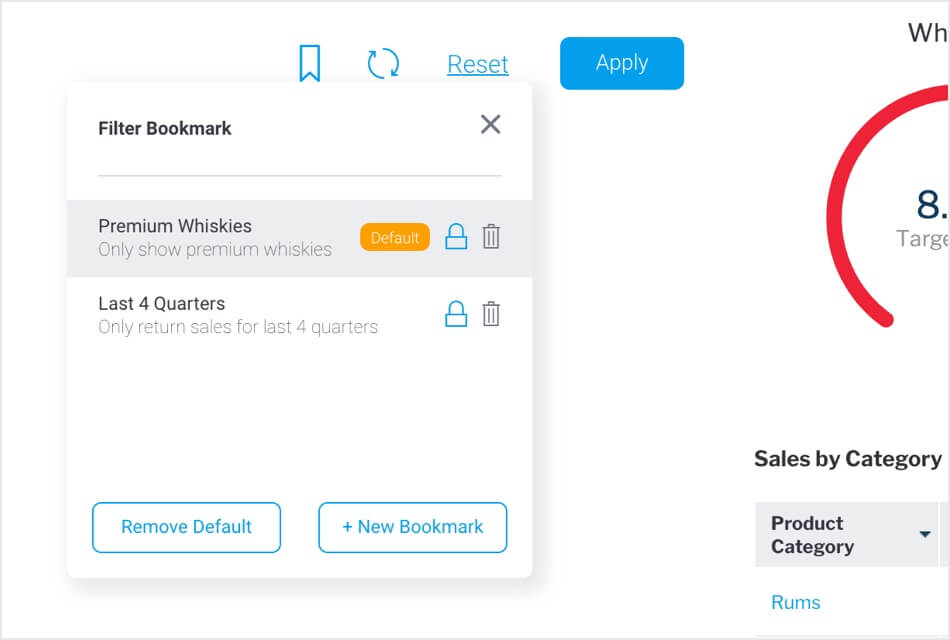
Default filter bookmarks on dashboards are now retained when dashboards are edited or imported into other Yellowfin deployments.
Export to PDF for dashboards has been enhanced to support both canvas and preset layouts, providing a full rendering of the dashboard including visual representations for JavaScript charts and Code Mode objects.
Dashboard Tab menu has been modified to only expand on a click. Improvements include adding Export to Files capability to this menu for dashboards in both native Yellowfin and embedded scenarios via JavaScript API.
Assisted Insights are now enabled for dashboards embedded with JavaScript API.
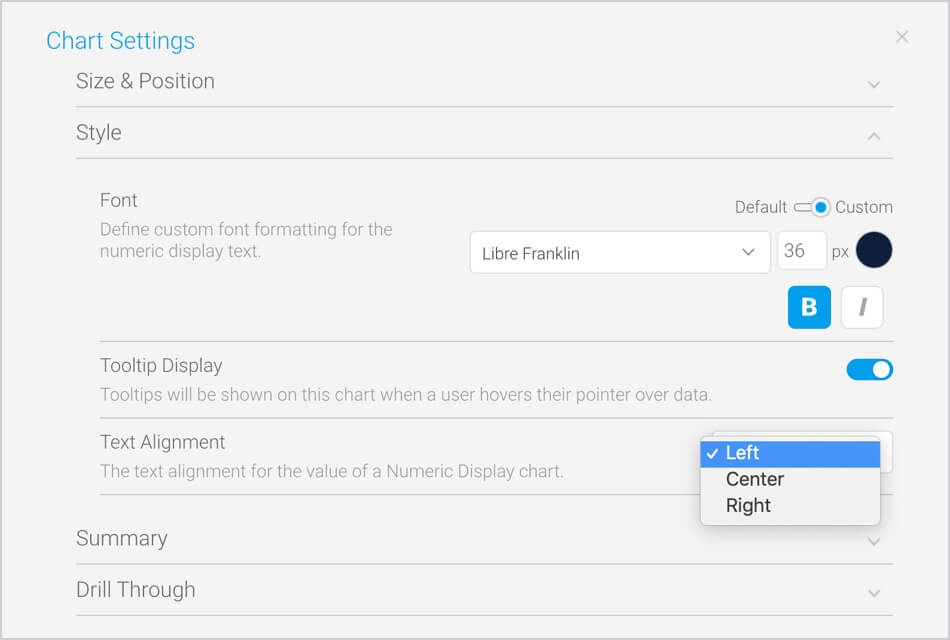
You can now apply left or right alignment to Numeric Display Charts, enabling greater control over spacing when designing canvas reports and dashboards.
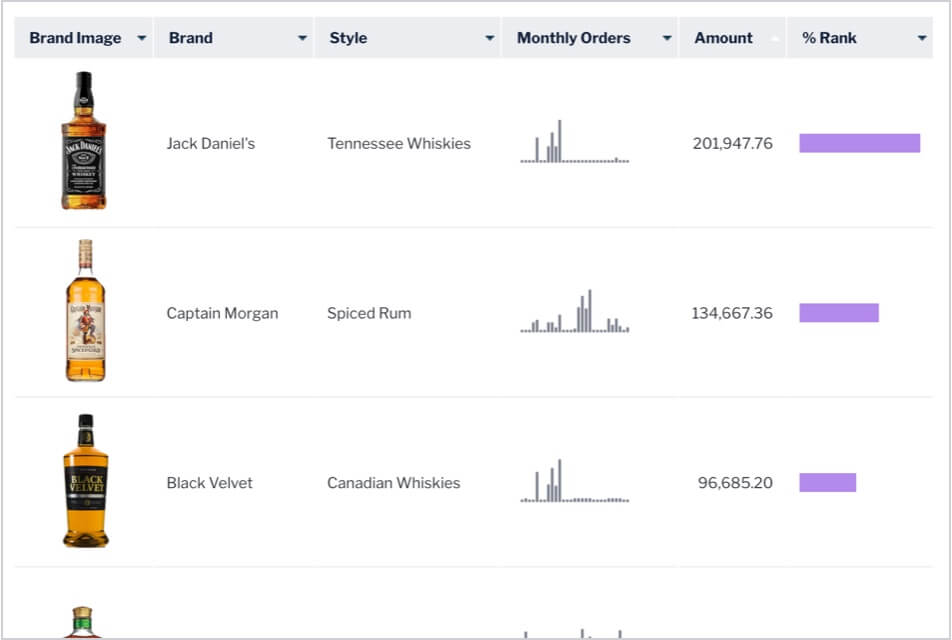
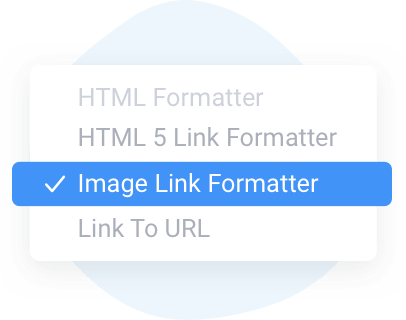
The new Image Link Formatter enables you to immediately display image URLs as visual images inline within the tabular report.
Positioning for totals and subtotals in reports have been improved to include top and bottom options for columns, left and right options for rows.
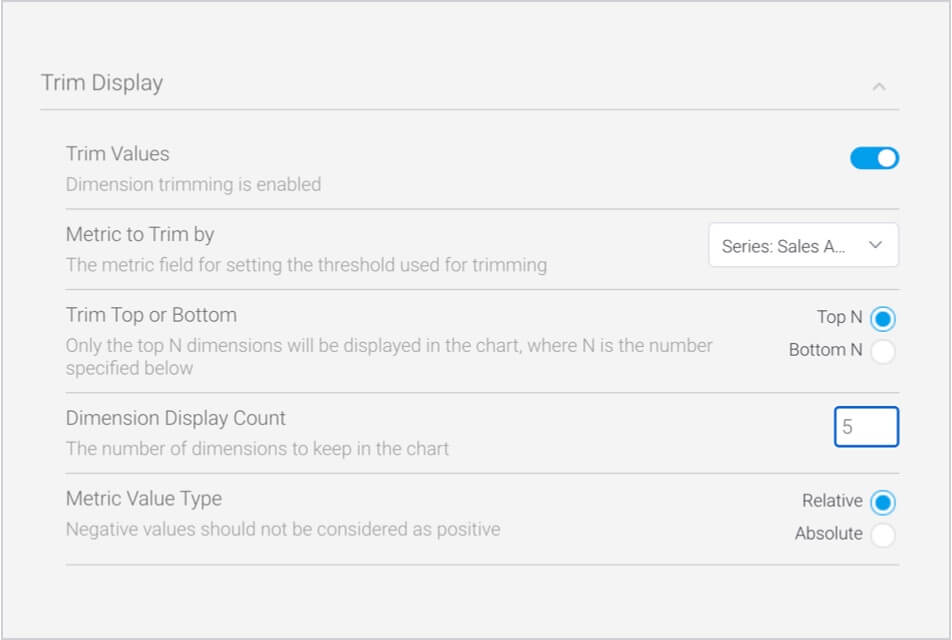
Trim Display for charts has been improved to allow colour dimensions to be applied.
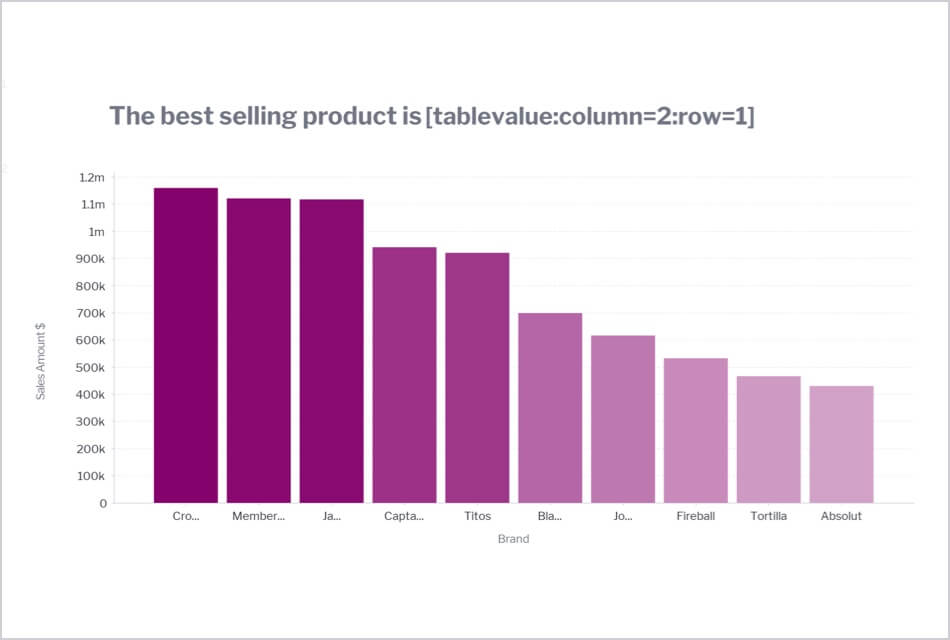
The new Tablevalue parameter allows you to display specific column and row data values from your tabular reports and retain column formatting in your Text Widgets.
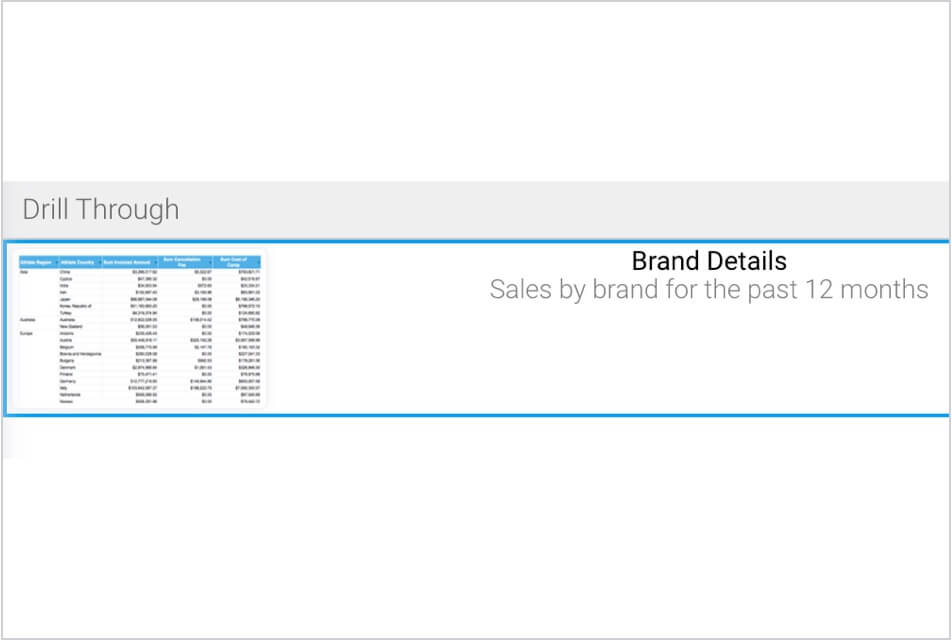
Drill Throughs can now receive and pass hardcoded filters when jumping from one report to the next.
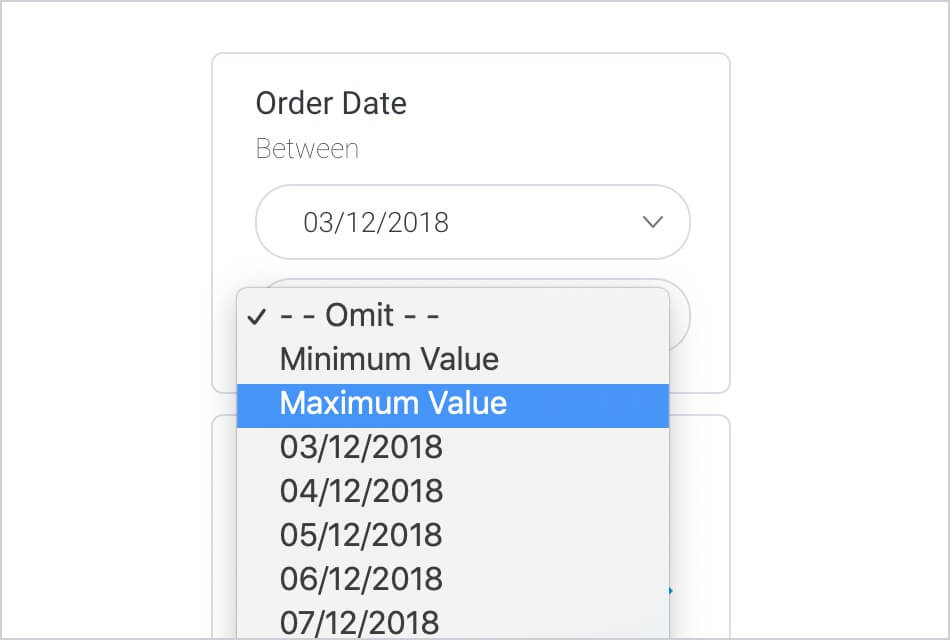
You can now toggle the appearance of Minimum and Maximum Values in the filter values list.
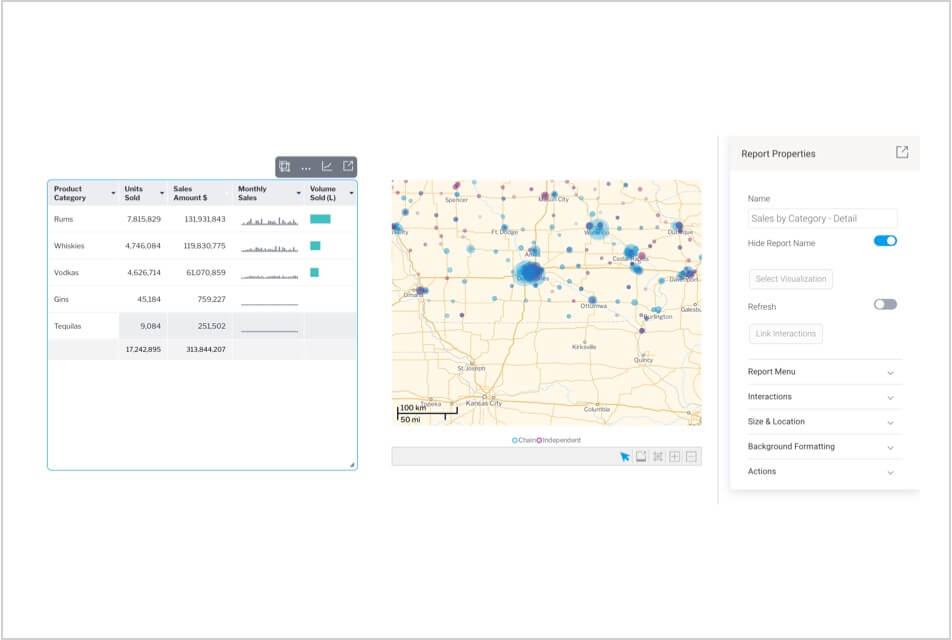
Report names can now be toggled on or off for both canvas and preset dashboard layouts.
The enhanced JavaScript API enables you to access every interactive dashboard feature (Drill Throughs, Brushing, Assisted Insights, Export, etc) and also toggle UI interactions for reports.
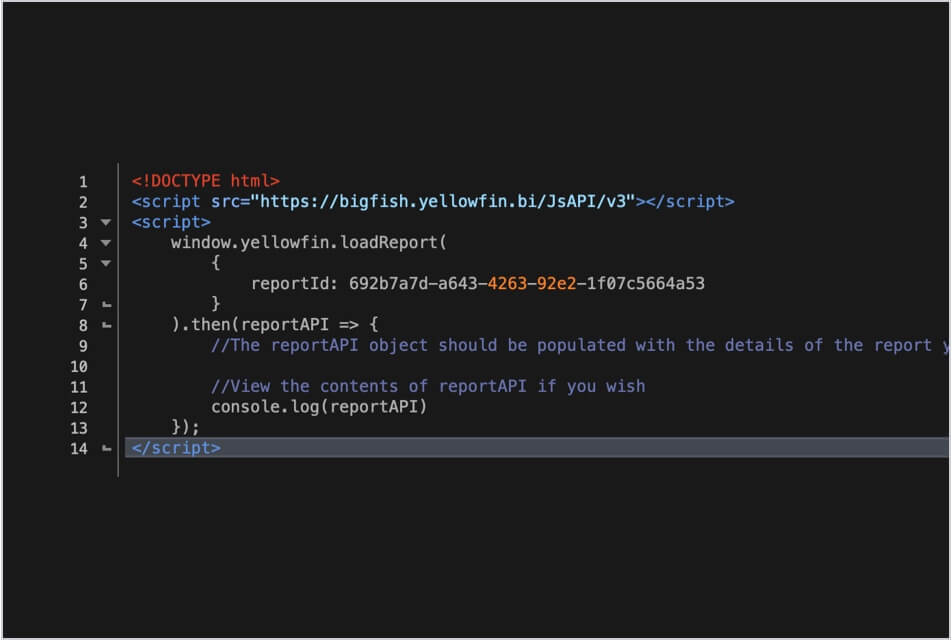
New and improved loadReport() and createReportElement() functions now enable you to easily load specific content types (report, charts, canvas) in your embedded deployments.
New customization options through CSS variables have been introduced to make it much easier and quicker to apply prominent colors across the entire analytics suite.
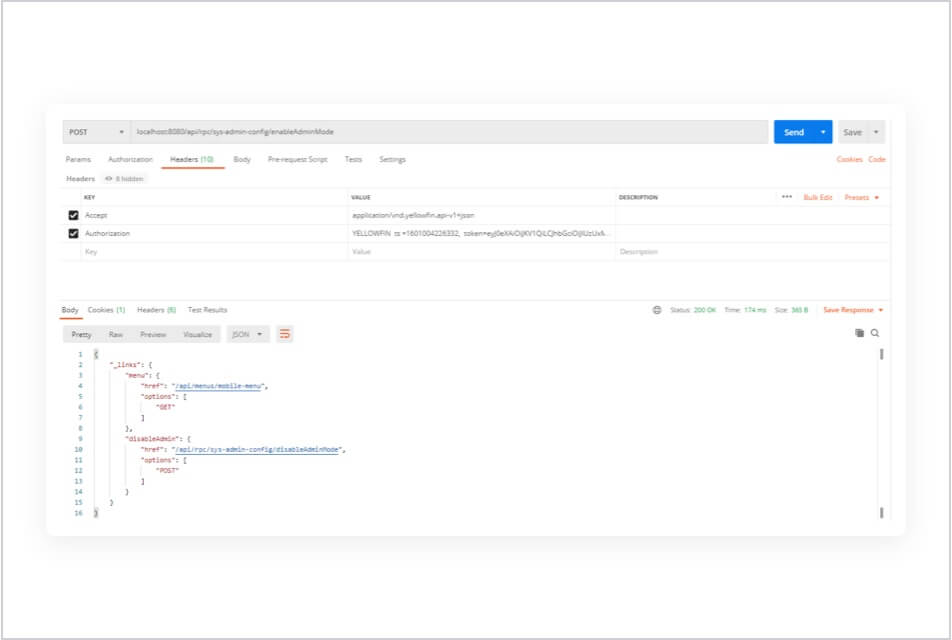
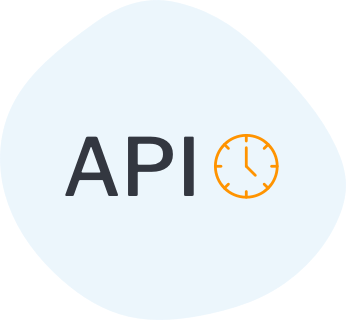
New Admin Mode toggle in REST API enables you to suspend new content creation in your clustered instances and ensure a smooth zero-downtime upgrade.
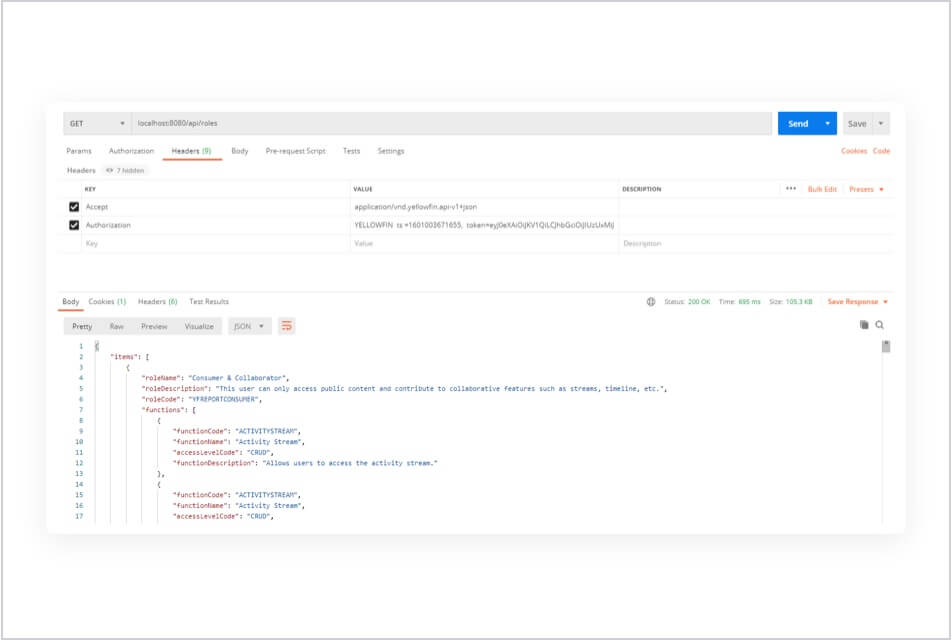
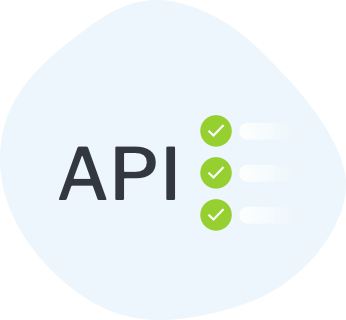
New REST API endpoints have been introduced, enabling you to manage user access to client organizations, roles, categories, content including cache management for content translations, retrieving broadcast alerts and much more. Read our release notes for a full list of updates.
New configuration options now allow for client organization-specific URLs to be used in Broadcasting.
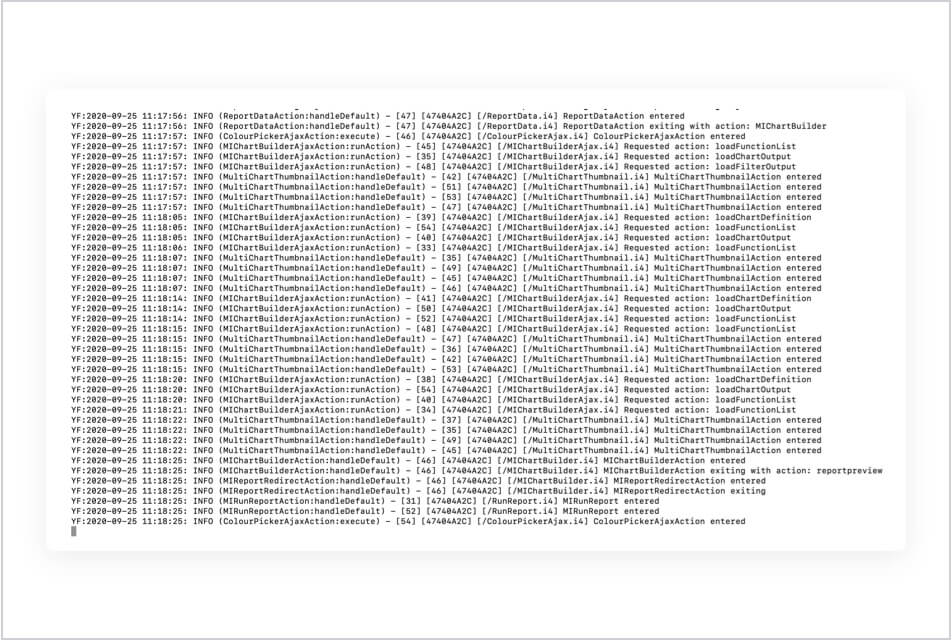
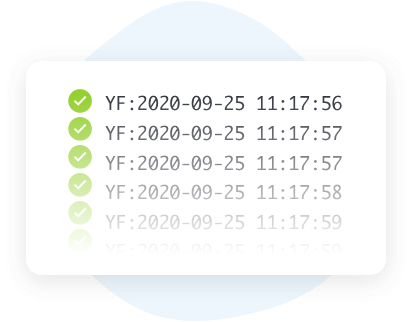
Application logging has been enhanced to include identifiers for threads and sessions including code functions.
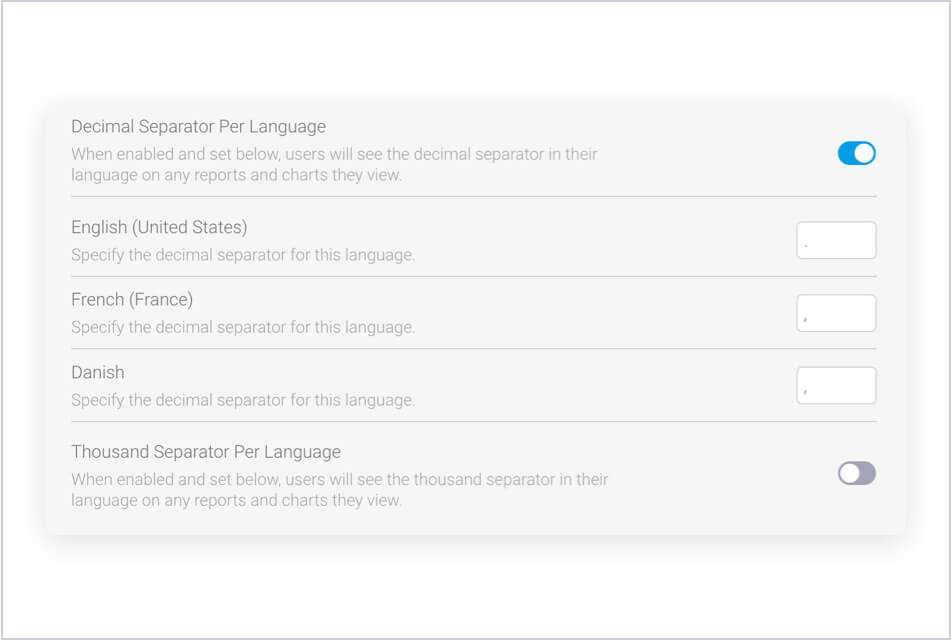
New configuration options for decimal and thousand separators enable you to set regional display preferences based on the specific language of your users.
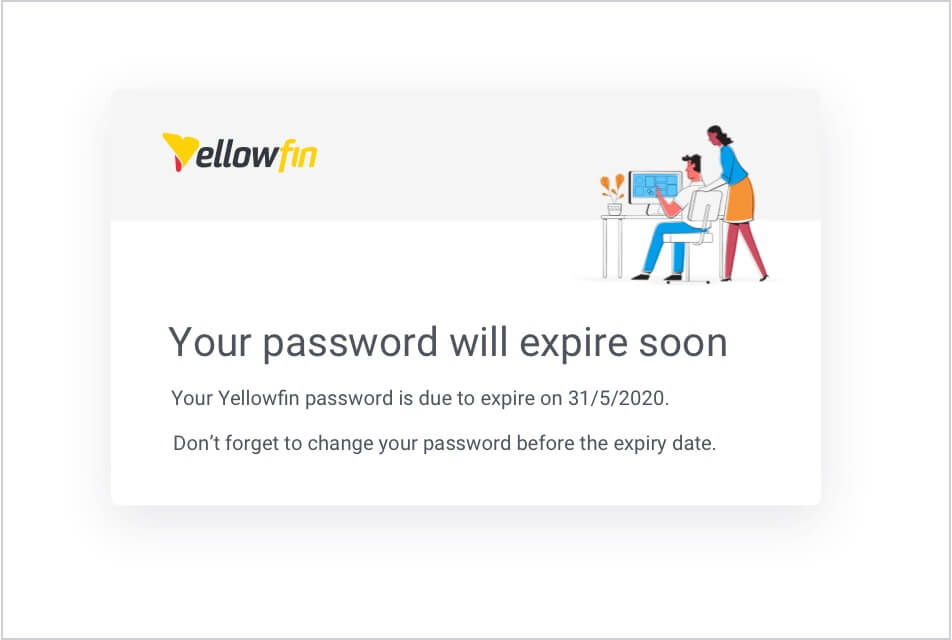
New configuration options enable you to apply password expiry policies including configurable expiry periods. Passwords approaching expiry dates will receive auto-reminder emails.
IFrame and Application integration can now co-exist in the same session. Improvements also include Multi Tab support for both integration methods and support for fixed-width host applications when embedding through Application integration.

Single Sign On (SSO) now enables you to programmatically check if an active session already exists within the browser before initiating a new session. Improvements include the ability to silently create sessions with web service tokens via Ajax.

Learn more about features in previous Yellowfin releases.

Download the latest Yellowfin release and see the full list of what’s changed.

Get started and learn everything Yellowfin has to offer.

Connect with people just like you in our community.

Let us show you the best analytics product on the market with the only analytics platform that combines action based dashboards, automated business monitoring and data storytelling capability.