
What’s new in Yellowfin 9.17
Yellowfin 9.17 makes analytics feel more conversational, more flexible, and easier to use in the moments that matter.

New Feature Highlights
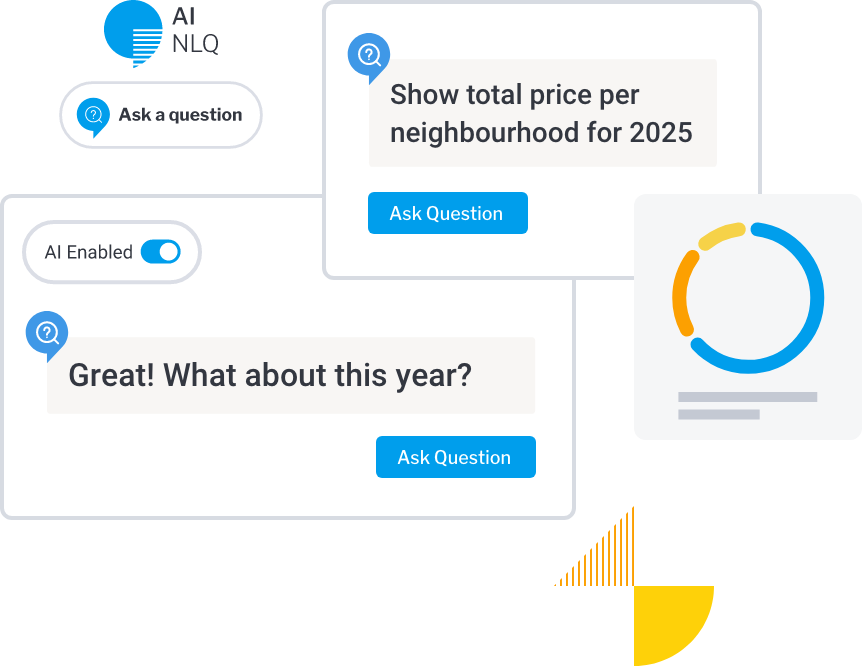
Yellowfin becomes context aware
The NLQ interface has been redesigned to support a smooth, chat-style experience where previous questions and answers stay visible on screen. Ask a question, get a result, then follow up without repeating context. Everything you explore stays in a View, and you can open any answer into a report, add it to a Story, Dashboard, or Presentation.
More capable & flexible
- Answers retain context, so follow-ups like “what about last quarter?” work naturally
- Switch visualizations on the fly without losing context
- NLQ is now fully responsive, adapting to screen size and browser resizing
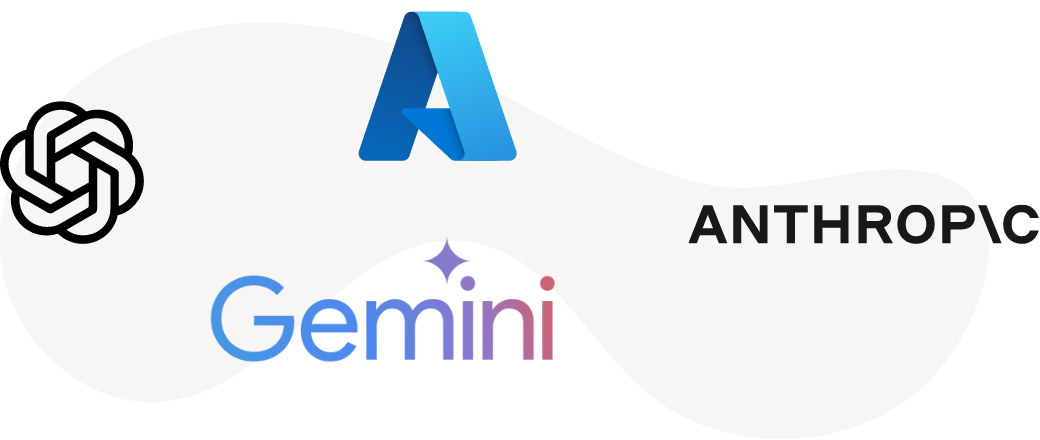
Expanded model support
The NLQ backend is now connected to the latest models from OpenAI, Anthropic, Google, and Azure, enabling more complex questions and richer output than before.

Responsive UI (Phase 1)
With 9.17, Yellowfin begins the rollout of a responsive user interface across key parts of the platform. The goal is simple: analytics should remain usable and clear regardless of screen size.
In this release, responsiveness has been introduced to the top navigation, Browse page, NLQ interface, Stories page, and their associated pop-up windows. Layouts adjust automatically to fit smaller viewports, collapsing menus where needed and preserving functionality without clutter.
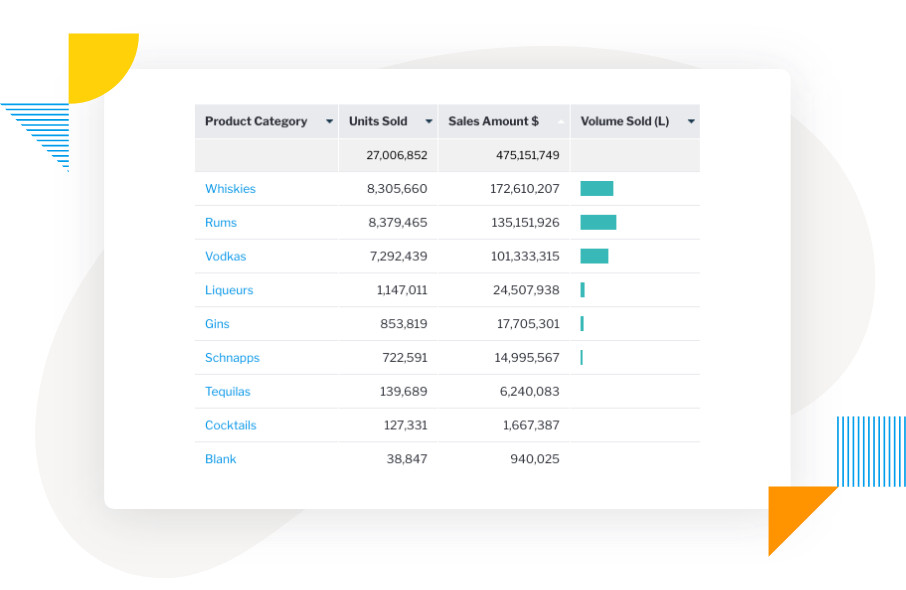
Better report control and interactivity
Reports in 9.17 give you more control without adding complexity. Fields can now be marked as always included, on by default, or off by default. A new column picker lets you choose which columns are visible and reorder them directly in the report output.
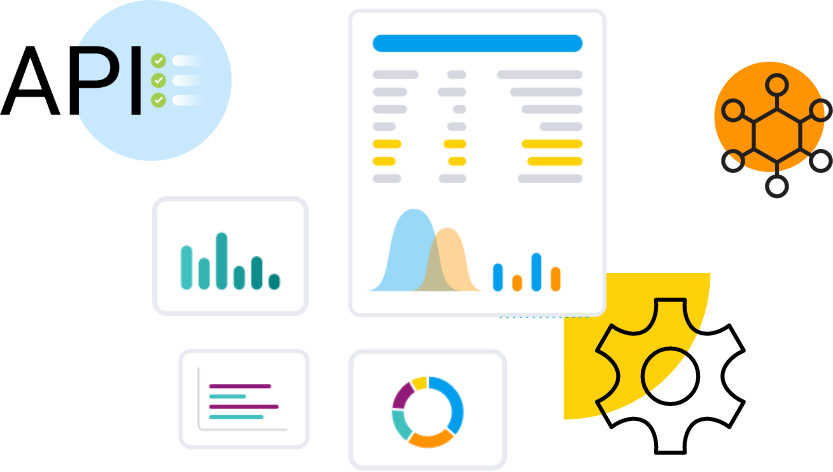
Additional improvements across the platform
Yellowfin 9.17 includes performance optimizations to support environments with thousands of client organizations, expanded import options in both the UI and REST APIs, and a new SSO session option that allows users to be redirected to a specific URL after login.
Together, these changes make analytics feel more natural, more flexible, and better suited to how people actually explore and discuss data.
Yellowfin 9.17 Overview
Check out the latest enhancements and see them in action.

Context awareness
Yellowfin now remembers what you asked for

Expanded model support
More support for the most popular LLMs

Responsive UI
Flexible layout that adapts to screen sizes
Better report control
Easier exporting options
Additional improvements
Stronger performance for scaling to thousands of users
Learn More About Our Releases

All Releases
Learn more about
features in previous Yellowfin releases.

Downloads and Release Notes
Download the latest Yellowfin release and
see the full list of what’s changed.

Yellowfin Wiki
Get started and learn everything Yellowfin
has to offer.

Yellowfin Community
Connect with people just like you in our community.

Get a Demo and see for yourself
Request a Demo of Yellowfin in action to see how the Yellowfin analytics solution solves data complexity through automation, dynamic data storytelling, collaboration and beautiful action-based dashboards allowing more people to discover, understand and do more with their data.
 Free Trial
Explore Yellowfin now on our sample dataset or try for free on your own dataset for 30 days.
 Request a Quote
Yellowfin is priced so that it is simple, predictable and scalable to suit your enterprise or embedded analytics needs.