
5 Best Practices For Data Visualization
Unlock the true value of your data

Enable more people to make smart decisions using your data
Separate the gold from the guff in your reports with 5 Best Practices for Data Visualization.
Your data is only as good as your ability to make it understood.
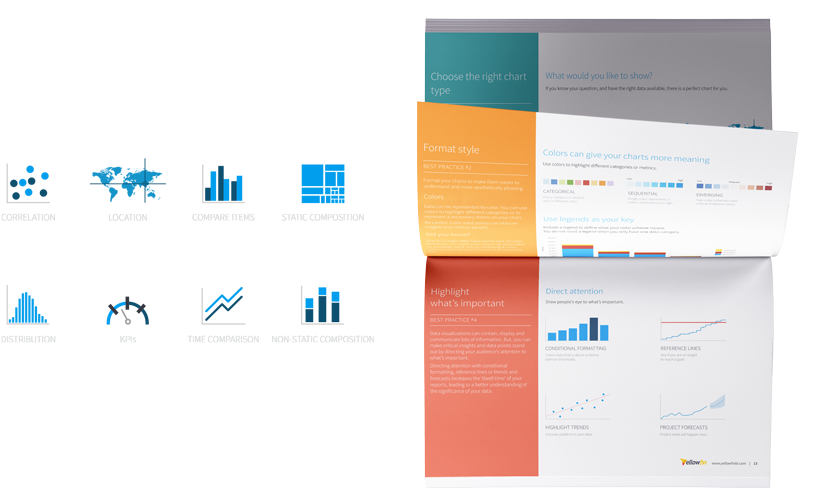
Download the guide and learn how to:
- Make visual information easily digestible
- Make data relationships clear
- Highlight critical data insights so people can make smart decisions
- Tell the story in your data to present your case.
Thanks! Here’s the link to your paper.
P.S. We’ve also sent a copy to your inbox so you have it for reference or for sharing with friends or colleagues.
Want to find out more about Yellowfin analytics? Request a free trial.