Glossary
Back to glossary
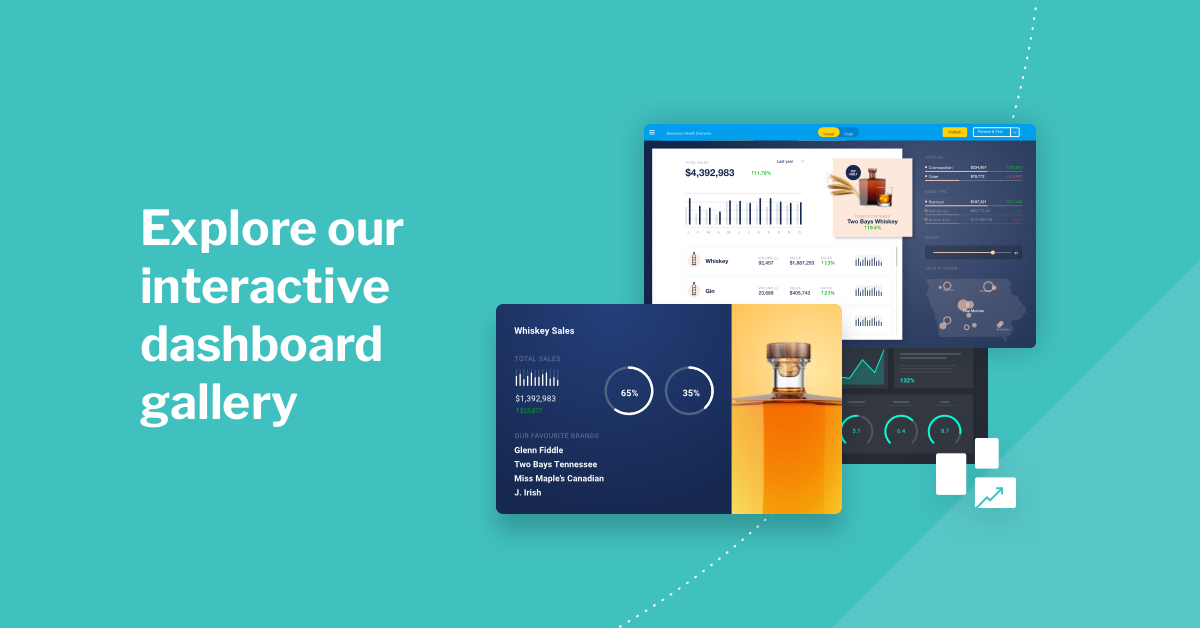
KPI Dashboard
A KPI dashboard is a visual display of key performance indicators (KPIs), measurable values that are used to monitor business performance against future objectives and evaluate failure or success in reaching strategic targets, such as for a project, a product or an entire organization.
Like regular dashboards KPI dashboards use powerful data visualization and data storytelling techniques, such as interactive charts, graphs and tables, to allow for quick and clear examination of actual performance, and help business executives uncover actionable insights.
Aside from clearly defining and establishing the key performance indicators the business wants to monitor and track, an understanding of analytic best practices around dashboard design and an analytics solution with extensive data visualization and data storytelling features is essential to guarantee your users can derive actionable insight and value from their KPI dashboards.
Read more: KPI dashboards: 6 Business Benefits & Best Practice Examples