
Glossary
Back to glossary
Dashboards
What are dashboards?
Dashboards are core reporting tools of data analytics and business intelligence solutions that aggregate and display critical metrics and key performance indicators (KPIs) in a single screen, enabling users to monitor and examine business performance at a glance. Dashboards extract and communicate high-level insights such as anomalies, issues and trends for end-users of all skill levels, before they choose to analyze data in more detail using advanced mechanisms like contextual analytics and AI analytics.
As a high-level reporting mechanism, dashboards ultimately provide fast ‘big picture’ answers to critical business questions and assist and benefit decision-making in several ways:
- Communicating how a business is performing according to defined targets
- Improving informational awareness for everyone
- Organizing operational data into a well managed format
- Visualizing complex relationships in a easy-to-understand way
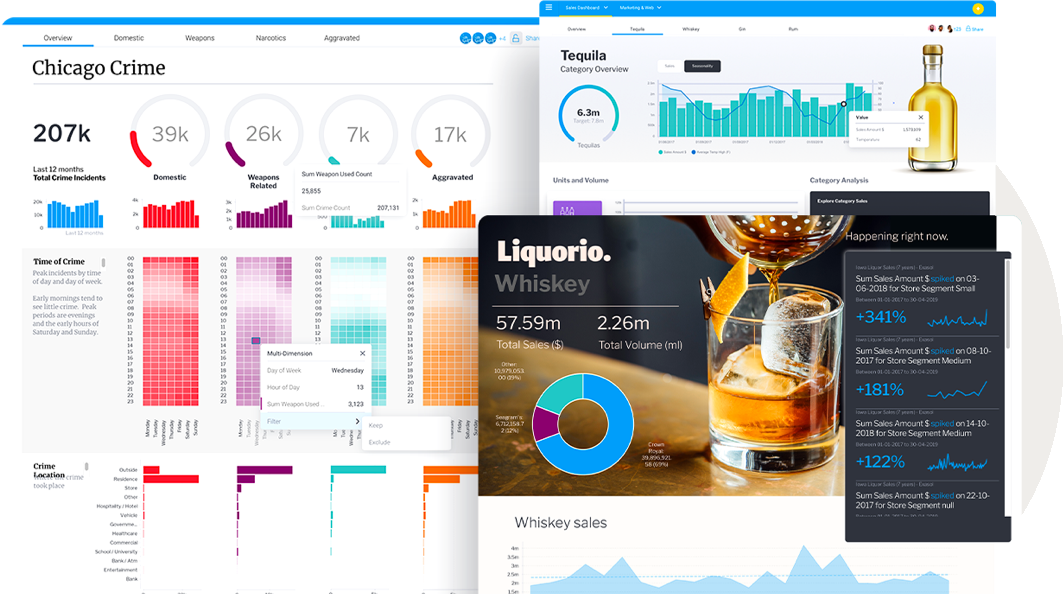
Business intelligence dashboards connect to files, APIs, and services and organize reports (metrics and dimensional views of data) into different combinations to provide end-users a full understanding of their key metrics and drivers. It displays metrics and KPIs as a tabular or cross-tabular report, or as one or more data visualizations such as charts, graphs and maps. Dashboards can also include user-defined filters, images and text, or include more than one screen tab of information. Finally, there are a number of dashboard benefits that make the tool ideal for companies looking to improve overall reporting.
Learn more
Types of dashboards
The look, feel and application of a dashboard can take different forms depending on the BI platform (embedded analytics or standalone solution) your business chooses to use. The use case for each type of dashboard is also dependent on the individual user’s specific role or skill-set.
Typically, there are three distinct types of dashboards:
1. Operational Dashboard
Operational dashboards provide end-users the ability to monitor specific day-to-day business activities, events or processes where data is constantly changing. They enable users to act on any changes they find immediately, and make short-term decisions to optimize performance. The data collected in operational dashboards is more real time, and reflective of what is occurring in the business at the moment of consumption.
2. Strategic Dashboard
Also called executive dashboards, this provides an ‘at-a-glance’ overview of metrics that users require to monitor business performance. Their purpose is to support decision-makers with insight into the challenges or opportunities the business may face by focusing on high level summary reports of performance and forecasting changes in those measures. They are typically built from aggregated data – time aggregations such as weekly, monthly or quarterly views – to highlight longer term trends and patterns.
3. Analytical Dashboard
Analytical dashboards provide end-users the ability to drill into the detail of their data and support root cause analysis. It is typically used by business analysts and line management, as they include more contextual data, comparative analysis and historical trends than other types. Analytical dashboards are useful for manually analyzing changes, though insight discovery is dependent on the user’s skill level. They also support additional advanced analytical capabilities, such as automated business monitoring and augmented analytics.
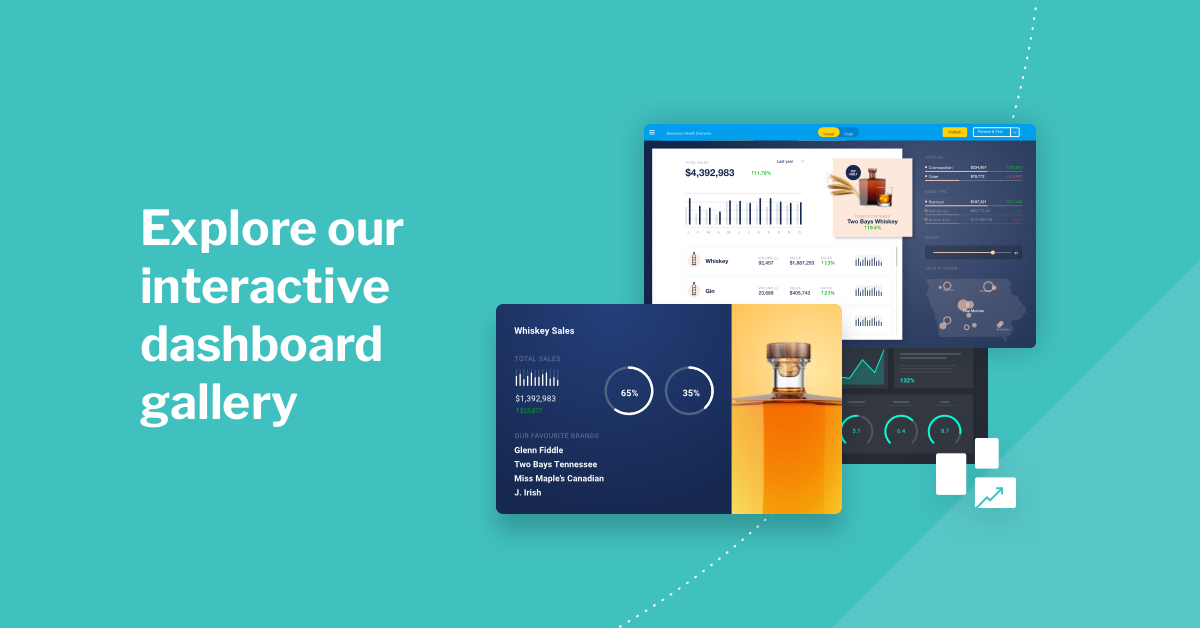
To help give you a more visual understanding of the use cases of dashboards, Yellowfin has an interactive dashboard gallery where you can view and interact with a live dashboard that follows best practices in real-time, using test data sets.
Why should you use dashboards?
Dashboards increase data accessibility and transparency across the business and are helpful for both regular business users and advanced data analysts in monitoring operational health and gleaning high-level insights into performance, before further analysis in advanced tools.
Dashboards have broad use cases across organizations, and with the continuous evolution of embedded analytics software, which has allowed dashboard reporting to be more deeply integrated into the daily workflows of the BI user, there are numerous considerations to factor in before use.
For more information on where to start with dashboards for your BI initiative, we recommend starting with our best practices video guide.