
St.LukesHealth Tranforms Reporting with Yellowfin Stories

Background
St.LukesHealth is an Australian not-for-profit health insurer on a mission to help its members get the best value health care for their unique financial and lifestyle needs. Based in Tasmania, it has provided services to local and national communities since 1952, with over 38,000 policies that cover more than 79,000 customers across Australia.
As a customer of Yellowfin since 2013, the fund has previously achieved success in automating its data manipulation, visualization and reporting efforts around member payroll processes. Now, with over 30 active users of Yellowfin, it has gone on to transform its reporting processes into a more time-efficient, engaging format using the data storytelling capabilities of Yellowfin Stories.
When someone is looking at a particular chart in our monthly reports, they can now drill into it or hover over elements and see both the narrative and numbers, which gives people more valuable information they can use in their own way. That’s one big ticket reason we use Yellowfin Stories.
Jared Blackwell, Senior Analyst – St.LukesHealth
Challenge
To enhance monthly reporting and flow of information to better help communicate critical insights for leadership analysis
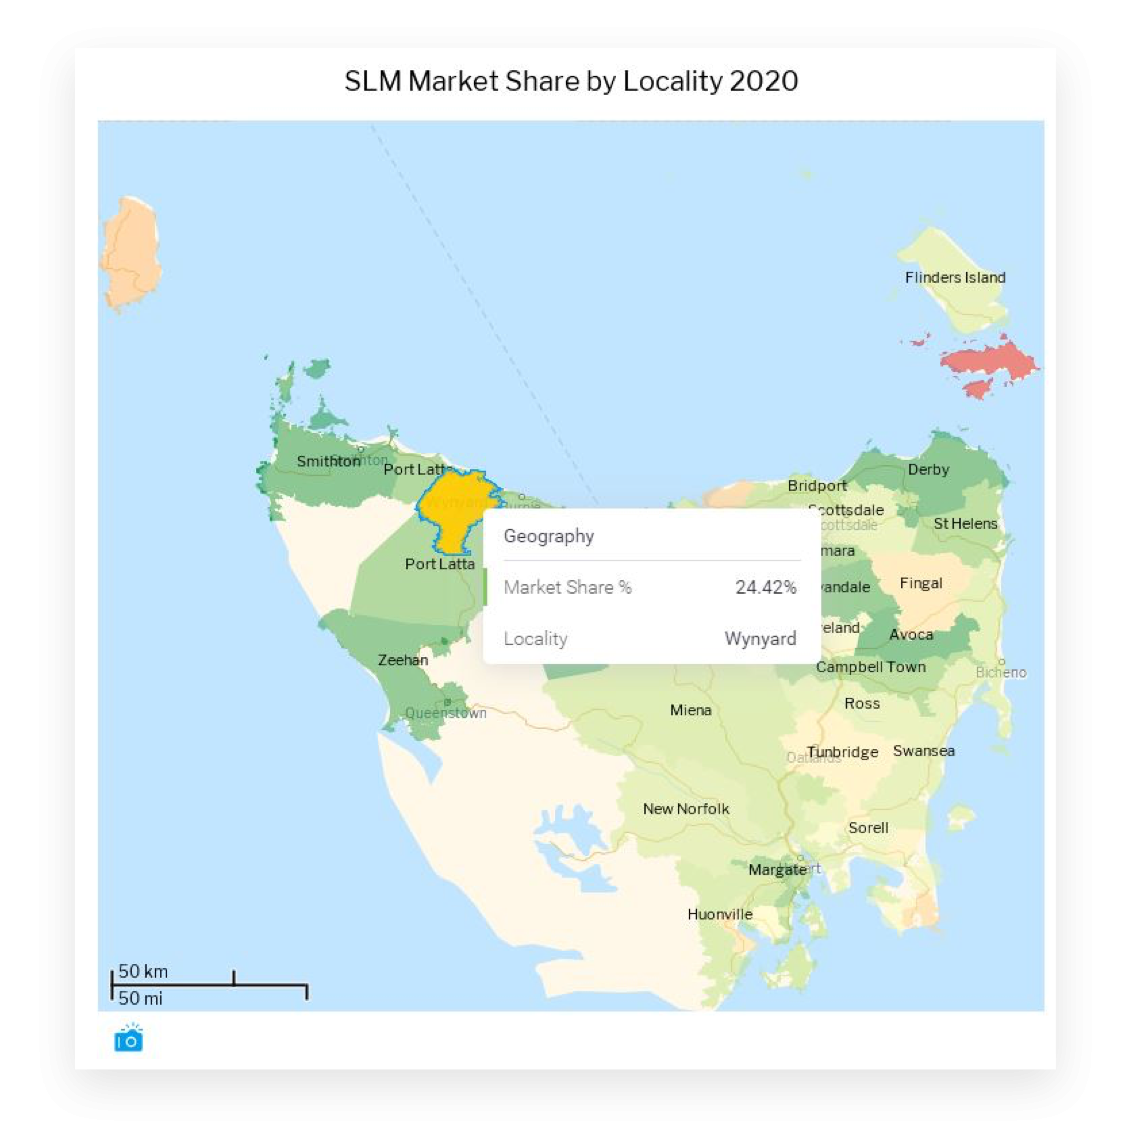
St.LukesHealth has a monthly requirement to provide analytics reporting to the Executive and Leadership teams, informing them of the latest internal updates, challenges and opportunities throughout the business. “In a typical report, we look at sales trends, net growth against budget, claiming and member trends and behaviours over time, deep dives into monthly successes, and general areas needing improvement,” St.LukesHealth Senior Analyst Jared Blackwell said.
Previously, this monthly reporting process was distributing data produced in Yellowfin using external tools including long-form email, Word documents and PowerPoint slides. However, using these methods proved time-consuming to produce, and the disparity in formats made it difficult to ensure reports were distributed to everyone, and that the data and stories within them were consumed in the intended manner.
In addition, many of the organization’s staff have several ad-hoc reporting use cases, such as benchmarking against other health funds using datasets released by industry compliance bodies, the Australian Prudential Regulation Authority (APRA) and Private Health Australia (PHA). As these reports were distributed in Excel and Word, there was a lack of interactivity with graphs and data, creating similar challenges around ensuring effective and timely distribution of reports.
Solution
From disparate reporting formats to visually clean, easy-to-consume, more engaging data-led narratives
St.LukesHealth strives to become a fully data-driven organization. As the audience of its monthly reports were time poor and had varying levels of familiarity with the data, the fund decided to explore the data storytelling product of Yellowfin, called Stories, to find better ways to communicate and share reports with key decision-makers.
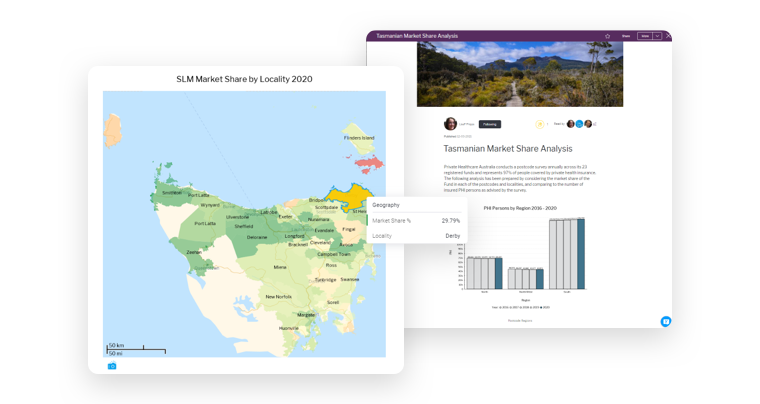
The fund’s first driver for selecting Stories was its presentation and distribution options, which allows creators to update people using a long-form, blog style format and share it across devices fast, all within Yellowfin. A unified interface appealed to their desire to replace the disparate nature of using external tools for data reporting, and it also allowed report creators to share findings and insights in a more appealing medium.
“When you’re trying to take the reader on a simple journey from point A to point Z, something like Stories is really handy,” Jared said. “If people see a Word document, sometimes they get apprehensive about needing to read several pages, whereas Stories lets you scroll through in a cleaner, synced and snappy format.”
 The second driver was its ad-hoc reporting requirements, as St.LukesHealth required a better method of making its non-monthly updates more impactful: “We might have normally sent an email and pasted in a couple of charts with some words – a very minor sort of report, but if there’s more rich information in the data to provide, we can instead use Stories to allow people to click, drill and hover over embedded data in the charts itself, while reading a more detailed story.”
Finally, as Stories is a part of the same Business Improvement platform many of St.LukesHealth’s users leverage for dashboards consumption, it would unlock an easier and cleaner method for directly embedding analytical content, such as graph visualizations and tables into updates, while alleviating the problem of time for both report creators and its audience to create and consume said reports.
Benefits and Future
A more efficient and unified monthly reporting process, and a data storytelling-driven culture
St.LukesHealth has greatly enhanced the flow of its business information for the Executive and Leadership teams analysis, and replaced their previously manual and exported monthly internal updates with Yellowfin Stories, using it to create data-led narratives since the start of 2021.
For Jared, the benefits of Stories in making it easier to share a monthly report with more impact is clear-cut. “When we once would normally have a Word document written that went out to the business, we now can instead use Stories for that to make it look good, and communicate to people who aren’t necessarily fully familiar with the numbers, using a far more engaging narrative format, and in the same user interface. When someone’s looking at a particular chart in a document, they can drill into it or hover over things to see the numbers, which gives people more information they can use in their own way. That’s a big ticket reason we use Stories.”
The fund has also realized significant time-savings with Stories, which was previously a major challenge when pulling snapshots of data into reports created in external tools. “The format of Stories saves a lot of time, taking only a few hours instead of our previous process which could take up to a day. Because our analytics team are using Yellowfin to build charts for their areas of work, they already have those visualizations in the same platform, and can share a Story much faster.”
Similarly, Stories has helped provide St.LukesHealth more options for making its ad-hoc reporting less random and more impactful. “We might look at the performance of particular groups of our members, such as corporate, and drill into that and highlight how groups are going by region using short-form narrative and charts. Scrolling down each Story just better reveals itself through that format,” said Jared.
With the Executive team continuously increasing its usage of analytics, and an increase in new staff that have analytical backgrounds, St.LukesHealth is looking to build a more data-driven culture within the next three years off the back of Stories. “We want to use dashboards to tell specific narratives in a similar way to how we currently use Stories, taking advantage of additional visualization options in the dashboard format. Otherwise, it’s more about increasing the utilization of Yellowfin throughout the fund; as much as we are utilizing it today, it can still be used more as a daily tool.”

See for yourself
Let us show you the best analytics product on the market with the only analytics platform that combines action based dashboards, automated business monitoring and data storytelling capability.
Get a Demo