
Data visualization tools for informed decision-making
Data visualization is at the core of communicating data effectively. Whether in chart or tabular form, Yellowfin BI enables you to create stunning visualizations which can be used to build compelling dashboards, data stories and presentations. Our data visualization tools enable everyone to see and understand trends, outliers, and patterns in their data.


Charts
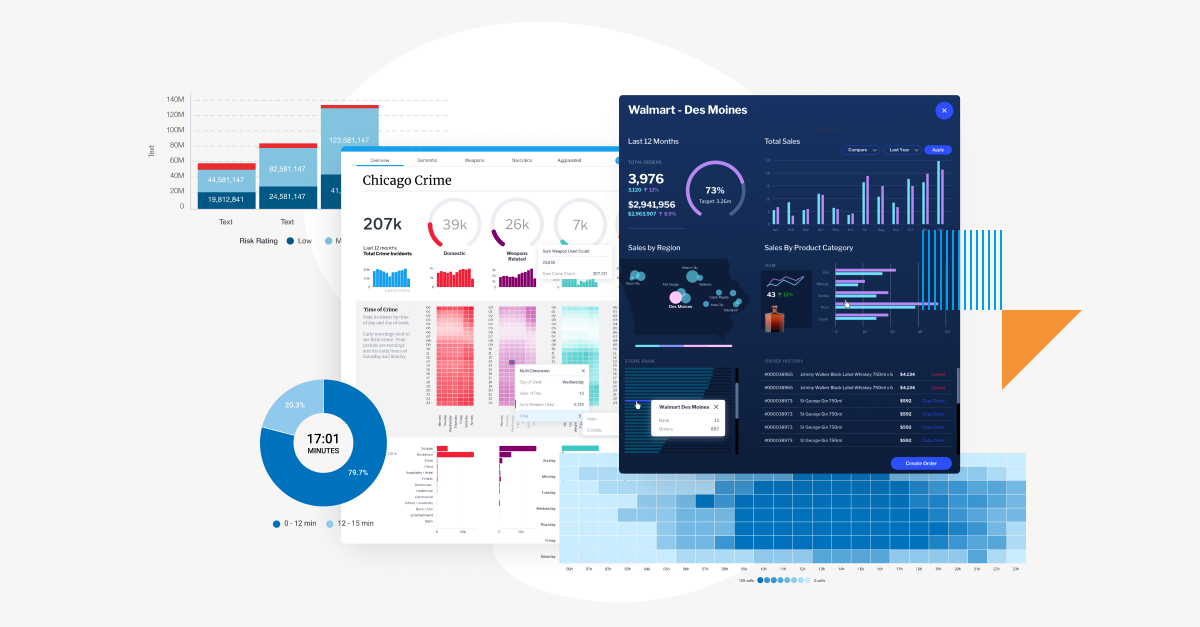
Create stunning visualizations
Bring your data to life with beautiful, interactive data visuals. Understand your business data from all perspectives with over 50 chart types—from simple bars and lines to trellis charts and infographics. With Yellowfin data visualization tools, the perfect interactive visualization is just a click away. Discover the insights needed to make better decisions today.
Tables
A fresh look for an old favorite
Whilst charts and visualizations are the go-to standard, tables can be exceptionally useful for dense visual design, and in many cases a better way to communicate data than a chart. Use sparklines, bar formatters and conditional formatting to make your tables pop.


Text and Typography
Tell it like it is
Make use of dynamic text options to create text prompts, titles or explanations of your data. Yellowfin data visualization tools makes it easy by linking text parameters to filter inputs or data outputs, and provides rich formatting options to make your text really stand out.
JavaScript Charts
A world of options
In addition to the comprehensive set of out-of-the-box charts, Yellowfin also allows you to to build your own utilizing your favorite JavaScript charting libraries such as D3, Highcharts, and three.js. If you have a specific interactive visualization need that cannot be met with standard charts, the Yellowfin JavaScript framework is the answer.


Maps
Put your business on the map
Yellowfin's Location Intelligence capabilities help put your business on the map. Effortlessly merge your spatial and traditional business data to discover your next big business opportunity. Use Yellowfin’s own built-in mapping capability or take advantage of Google Maps API—the choice is yours.
Images
Tell a story with your data
Bring imagery into your reports and dashboards—use data ‘content’, such as a logo, for a brand-specific report or as visual elements to assist the user with identifying the context for the report or dashboard.


Shapes
Graphic components to create data experiences
Use shapes to highlight or draw attention to data. Boxes, arrows and lines help frame numbers, charts or text, and also draw attention to the data or create partitions so that a large canvas can be visually broken into separate sections.
Canvas
Combine it all for greatness
The Yellowfin Canvas enables you to combine all visualization types into a single cohesive object, whether as a single report containing multiple elements, or as a dashboard tab with many reports, text, and image elements. The canvas is pixel-perfect, providing you with full control over the layout of your components.

A data visualization is just the beginning
Yellowfin empowers anyone to create data visualizations, and offers a range of ways to share insights to ensure data is at the heart of decision-making.

Create
Create data visuals using a variety of methods to suit your needs and skills. Use quick charts on a dashboard for simple data visualizations, leverage Guided NLQ to create more advanced intricate visualizations, and for very specific designs, use Yellowfin's intricate report builder to get the most out of our data visualization tools.

Share
Share data visualizations in a variety of ways: add them to your dashboards, use them in your data stories or presentations, or simply share them as single reports that can be accessed ad hoc, or scheduled via email on a regular basis. Whatever your use-case, collaboration is enhanced with Yellowfin's rich data visualization tools.
Resources and further reading


7 Key Benefits of the Best Data Visualization Tools in 2025
Explore the business benefits of data visualization tools and adopting business intelligence solutions with the richest graphs and charts, to understand how it can suit your own users and use cases.
What is Data Visualization and its Importance in Business Intelligence?
Learn the fundamentals of business intelligence and data visualization and why data visualization is so important to consider when choosing a BI and analytics solution.
Top 10 Essential Types of Data Visualization of 2025: From Basic to Advanced
Discover the most prevalent techniques of data visualization, from line graphs to pie charts to heat maps, and see for yourself what they look like when using Yellowfin's rich data visualization tools.

Get a Demo and see for yourself
Request a Demo of Yellowfin in action to see how the Yellowfin's data visualization tools solve data complexity through automation, dynamic data storytelling, collaboration, and beautiful action-based dashboards allowing more people to discover, understand and do more with their data.
 Free Trial
Explore Yellowfin now on our sample dataset or try for free on your own dataset for 30 days.
 Request a Quote
Yellowfin is priced so that it is simple, predictable and scalable to suit your enterprise or embedded analytics needs.