Glossary
Back to glossary
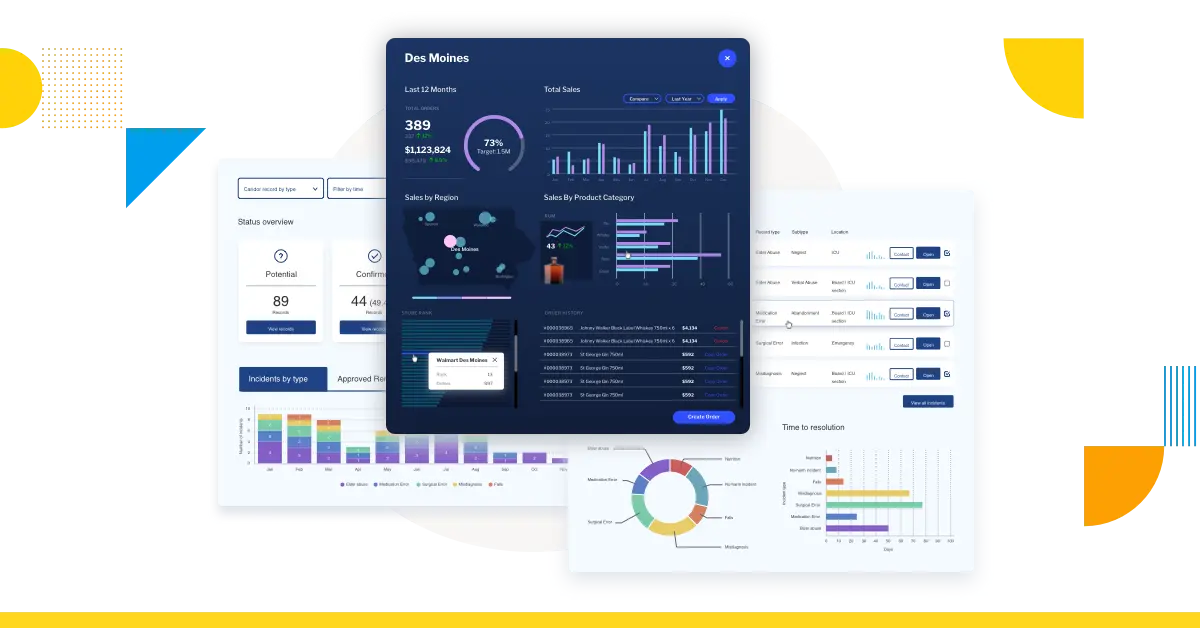
The best business intelligence reporting solutions
BI reporting
Business intelligence reporting, also called BI reporting, is the use of a data analytics software solution by an individual or organization to collect, prepare, and present data so it is readily accessible for consumption, accurate for analysis, and reliable to inform future business decisions.
Also known as:
- Analytics reporting tools
- Business intelligence reporting tools
- Business intelligence reporting software
What is BI reporting used for?
The purpose of business intelligence reporting is to enable people throughout an organization to access, measure, monitor and display data in a manner that is user-friendly and digestible, and does not need extensive data expertise or knowledge to understand. BI reporting is used to provide better ways for everyone to acknowledge business performance and output, and empower decision-makers to act based on curated sets of data.
The process of business intelligence reporting typically involves collecting data from internal systems and external sources, which is then prepared for consumption, analysis and running queries against the data. Key metrics are organized using several tools such as cross-tab reports, data tables, and data visualization features, and then presented in the form of a dashboard or data story for analysis. In comparison to traditional operational reporting, BI reporting provides a more visual-based, interactive interface to explore the numbers, and identify problems and trends.
BI reporting examples and use cases
The exact process, label and capability of analytics tools that enable BI reporting varies between business intelligence software vendors. Most provide basic reporting capabilities and programs for data preparation and analysis, including data modelling and mining, connectors to sources (APIs, spreadsheets, relational and analytical databases) and exploratory, statistical and predictive analysis.
Many platforms also provide advanced capabilities for both the preparation and presentation of data (BI reporting) and eventual analysis. For example, Yellowfin provides, as part of its suite:
– Automated business monitoring
BI reporting benefits
To collect, curate, manage and analyze large amounts of data manually requires significant expertise and time, even for experienced analysts. Business intelligence reporting leverages technology to make it easier for business people of all skill levels to consume and analyze data.
There are many well-documented benefits of business intelligence reporting. The main include:
- Better informed and reliable data for decision-making
- Competitive advantage and differentiation
- Faster and easier reporting of business performance and output
- Foster data culture throughout the organization
- Operational efficiency and optimized processes
Where once only experts and analysts could analyze data, the proliferation of self-service BI software solutions has made BI reporting widely accessible for non-technical professionals. With the right platform, all users can benefit from having BI reporting tools, and make better decisions.
The best business intelligence reporting solutions
Analytics software vendors with the best BI reporting tools are annually rounded up by Gartner Research to help organizations around the world find the best technology solutions on the market. Yellowfin received the second highest scores in the 2021 Gartner Critical Capabilities for Analytics & BI Platforms. To read the latest report, click the banner below.