

What is Augmented Analytics? - Definition & Top Benefits in 2026
Key takeaways

-
- Augmented analytics uses machine learning and natural language technologies to support better analysis of data.
-
- It provides valuable insights into data to people whether or not they are tech experts.
-
- By using augmented analytics, data preparation and insight discovery is now open to more people, making self-service analytics more achievable for more businesses.
Blog Contents
show
What does augmented analytics mean?
The definition of augmented analytics is the use of technologies such as artificial intelligence (AI) and machine learning (ML) to transform how analytics can be built, consumed and shared, making insights more accessible and impactful for all types of users. An alternative term that is also being used by consumers to describe AI-powered analytics is known as AI analytics, with augmented analytics first being coined by Gartner.How did Gartner define augmented analytics?
Gartner originally defined augmented analytics as the integration of AI and ML throughout the data analytics automation lifecycle, covering data preparation, discovery, insight generation, and explanation. This approach aims to democratize analytics by automating complex tasks and making data-driven decision-making more accessible to everyone.How is augmented analytics designed for all users?
Unlike traditional analytics tools, which were often IT-led and geared toward specialists, augmented analytics empowers everyday business users. It reduces dependency on data science teams by automating technical steps, such as data modeling and statistical analysis, that were typically and previously only found in specialized data science and machine learning (DSML) products.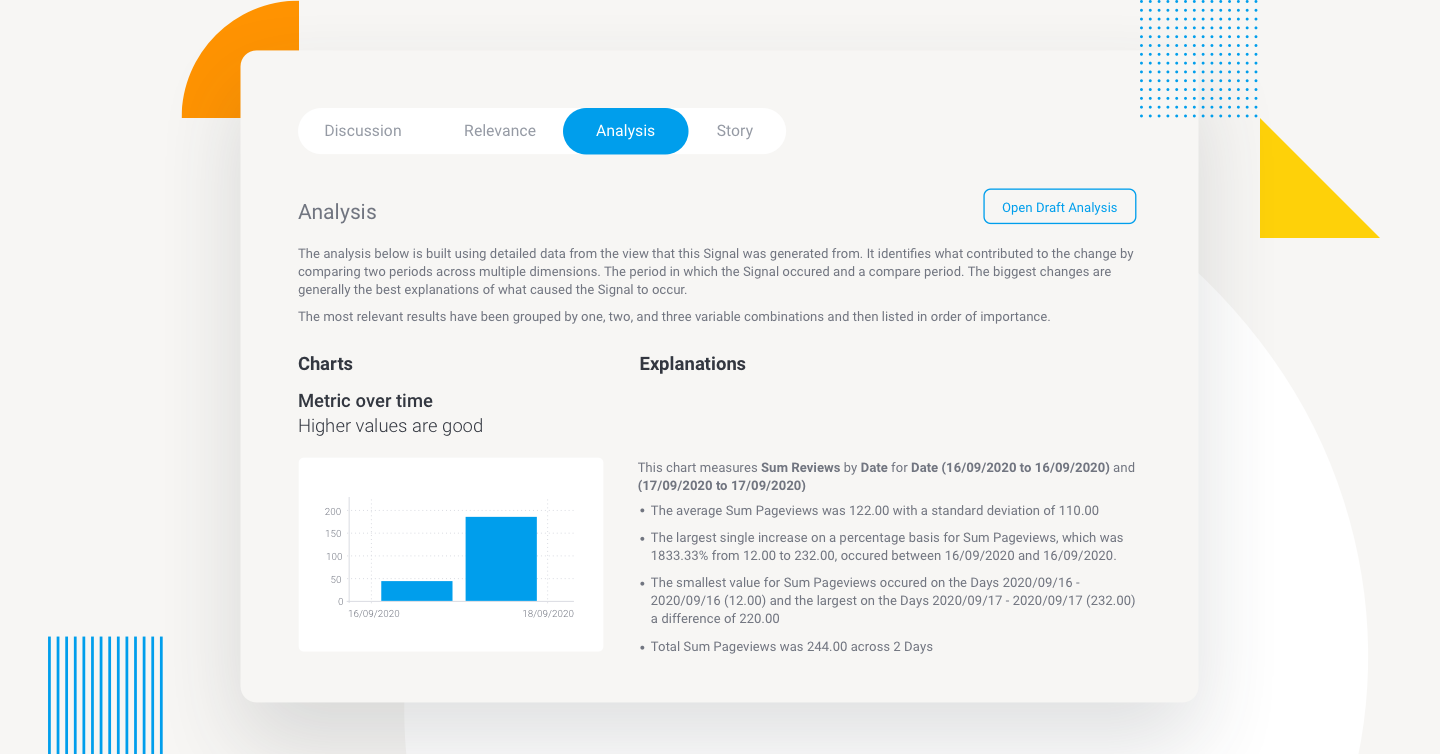
How has augmented analytics evolved to support business users?
Recent business intelligence (BI) platforms now embed AI and machine learning directly into user-friendly, visually based tools. This convergence of data, analytics, and DSML capabilities enables non-technical users to explore and act on data insights without requiring deep technical expertise. This has created a new designation of user, called the augmented consumer. For a deeper dive into the history of analytics and an explanation of its evolution into modern BI – and how we got to augmented today – we recommend watching our explainer video on Augmented Analytics Explained, embedded below.What is the purpose of augmented analytics?
Analytics has become ubiquitous in our day-to-day life. It’s a key component – be that via monetization or measurement – in creating and identifying value in our business. However, the complexity and volume of data every business accumulates is a common challenge for those that need to make decisions. Data is a continuous and always growing consideration, and it can be particularly challenging for larger enterprises. For business users, being able to comprehensively track, identify, understand and act on what is most important – and inherently know the best action to take – is an increasingly impossible task to accomplish manually, resulting in decisions that might not be entirely data-led and rely too much on instinct. There’s an ever-pressing need to keep up with the fast-growing data we need operationally and long-term – this is where solutions like augmented analytics come in, and how its various capabilities streamline the data and analysis process for both non-technical, regular business people and data experts.How does augmented analytics work?
Augmented analytics, also now called AI analytics, plays a crucial role in every step of the analytics process, from gathering data, identifying patterns, analyzing it, to sharing insights. Here's how it works when you use an analytics solution that provides AI tools:- Data ingestion and preparation: Algorithms speed up the process of taking raw data, transforming and cleaning it, and integrating it, all automatically. They make it possible to identify patterns, relationships, and unusual points in the data, allowing analysis to begin more quickly.
- Automated data discovery: Modeling data with machine learning means data is automatically checked for new trends, differences, and error signs. Because monitoring is constant, it allows for faster reaction, and makes it less likely that important trends, anomalies or patterns are skipped.
- Natural language interaction: Users can query business information within datasets by typing in their questions into the BI solution, and they typically get best practice data visualizations and helpful explanations in the results, conveyed in everyday language, right away. It helps people who are not programming or BI experts use complex data.
- Insight generation: The system uncovers trends, makes comparisons, and presents stories or visuals to help people understand. Insight generation tells you what to do or explore next to prevent making the wrong decisions.
- Collaboration: Automatic sharing allows everyone relevant to instantly gain insight, which appears in dashboards, applications, or alerts for fast collaboration.
Who should use augmented analytics?
Augmented analytics is beneficial for a wide range of users across industries and business functions, including:- Business users: This type of AI-powered business intelligence solution is useful for sales managers, marketers, and operations teams, given how simple it is to extract insights. |
- Data analysts and scientists: Experts can leverage AI-powered tools within an augmented analytics solution to handle basic analysis jobs, build upon its output quickly, and pay more attention to important strategic modeling and deeper analysis.
- Executives and decision-makers: Leaders can get a deeper view into organizational performance thanks to augmented data and spot new situations earlier.
- Software developers and product teams: Independent software vendors (ISVs) and their developers can add augmentation to their product applications and provide customers with give analytics tools that improve the user experience.
What techniques make up augmented analytics?
Augmented analytics encompasses a number of emerging, evolving and established techniques in the arena of analytics, which include, but are not limited to the following:Augmented data preparation
These typically encompass advances in data preparation, or more typically the ETL (extract, transfer, load) phase. This can include the use of algorithms to detect schemas and joins, profiling and data enrichment through the automation of data transformation steps.Automated analytics
Also called automated business monitoring, this typically enables the running of always-on analysis in the background. This automates the manual data discovery process and can immediately surface relevant changes in data (example – trend change), which greatly accelerates time to insight. This form of augmented analytics is particularly beneficial for large data sets with high dimensionality.Natural language
Natural language generation (NLG), natural language processing (NLP), and natural language query (NLQ) have become mainstream in modern BI platforms today. Combined together, they automatically generate rich descriptions of insights found in your data to make complex information easier to understand and often less intimidating. These technologies may also include functionality to read and interpret text or voice, and allow an analytics user to query data using non-technical terms as they would in true natural language, enabling the user to better engage with data through a more streamlined interface. Yellowfin NLQ tools aim to make asking questions of data even easier with automatically generated suggestions for end-users to build data questions, and results explained in natural language so that everyone, not just data experts, can understand.Machine assisted insights
This can be in the form of machine-generated data visualization, calculation creation and variance analysis, and is often triggered by the action of the user asking a question. For example, a user could see a spike on the chart and click on the spike to explain ‘why’ the spike occurred or compare it to another period. The machine assisted insight auto-generates the analysis, calculations, and building of any charts. This process of deeper analysis may have been previously performed via filters on a dashboard (if available) or the generation of a new query to answer deeper questions. These many capabilities are increasingly available in modern BI platforms, so much so that the Forrester Wave for Enterprise BI Platforms expects augmented analytics will dictate which providers will lead the pack heading into 2025 and beyond. According to Forrester, having a modern BI platform with the extensibility that augmented analytics offers is a critical factor that will determine the difference between an industry leader and a laggard in the long term.How is augmented analytics used in organizations today?
From large enterprises looking to reduce the analytic load of their teams, to surfacing risk and opportunities immediately or for software developers adding capability and value beyond traditional reporting, use cases for augmented analytics are broad. This is particularly true for industries where the data and the variables being analyzed are complex enough or too vast in volume for their users to be able to comprehensively and reliably perform analysis with their current manual approach. It doesn’t take an expert to unlock its value — augmented analytics can and should be applied across diverse industries and use cases. Let’s explore some real-world examples of how AI-driven analytics is making an impact.Banking sector
In Gartner’s report, “Top 10 Data and Analytics Technology Trends That Will Change Your Business”, the firm noted some prominent examples. As one of the leading augmented analytics use cases, many entities in the banking sector previously targeted older customers for wealth management services, but recognized there was a gap in insights. They then used augmented analytics to automate the analysis of their high-volume data and ask deeper questions, before discovering the 20 – 35 age group were the demographic most likely to engage.Agriculture industry
The agriculture industry reduced the time it took for data scientists to build models, using augmented analytics to find the top hybrid seed combinations to sell to farmers within a dataset of thousands, bringing time-to-insight down to days instead of months, allowing other users without technical know-how to take over the analysis process.Retail and eCommerce (KYOWA)
Yellowfin Signals exemplifies the practical application of augmented analytics in retail. KYOWA, a health food and cosmetics manufacturer, faced ongoing challenges with manual inventory tracking and stock-outs. By implementing Signals, they automated the detection of inventory anomalies based on shipment trends and other variables. This eliminated manual reporting, improved ordering accuracy, and has helped KYOWA are currently tracking toward zero.
What are the top 4 benefits of augmented analytics?
Having AI and machine-based analytics isn't just a talking point, but a major benefit. Augmented analytics and its forms are becoming tightly intertwined with the end-to-end analytics process, and bring numerous advantages for software vendors and enterprises. It’s vital to understand how it helps users in all stages of analysis.Immediate automated analysis
The heavy lifting of manually sifting through huge volumes of complex data (due to lack of skills or time constraints) is significantly reduced as analysis is automated and can be set to always run. If your augmented tool finds a spike or drop or change, it can also automate the delivery of that insight, ensuring that users can then act immediately.Faster data preparation: augmented data
Preparation brings data together from multiple sources much faster. Algorithms can be used to detect schemas and joins, repetitive transformation and integrations can be fully automated, and data quality and enrichment recommendations are auto-generated by the system. You can even automate the profiling, tagging and annotation of your data before you start data preparation – and clean it for reliable analysis in a fraction of the time it takes manually.Improved data literacy
With natural language assisting in the explanation of discoveries and providing automated analysis of results, your users can improve their data literacy. This can assist in fostering a data-led culture that benefits the organization as a whole for the long-term.Reduced analytical bias
Enabling the machine to perform analysis can assist in reducing analytical bias. If you don’t know what you’re looking for, you make assumptions trying to find it. Often, those assumptions could lead to the use of specific data to support it. Augmented analytics can minimize potential bias often performing analysis across a wider breadth and depth of data, looking purely at factors of statistical significance. However, be aware that bias can impact the machine. For a more detailed dive, read our blog on the practical benefits of augmented analytics.What are the challenges of augmented analytics?
Despite its benefits, there are a few challenges related to augmented analytics that need to be addressed for successful implementation:- Data quality: Increased insights depend entirely on having high-quality data. Missing or inaccurate information may result in wrong findings.
- User trust and adoption: It can be hard to convince users if the results seem to come from nowhere, and they cannot understand the reasoning.
- Too much on automation: It helps with regular tasks, but relying on it too much may decrease sharp, personal decisions made by real people.
What are the best practices for using augmented analytics?
Augmented analytics is helpful for businesses to get actionable and accurate data insights fast. The following best practices will help organizations make the most of augmented analytics:- Invest in data readiness: Make sure your information is correct, is all integrated, and has clear documentation.
- Start with high-impact use cases: Begin with data where you can see the results quickly, such as sales forecasting or monitoring operations, to gain support and keep the project moving.
- Cross-functional collaboration: Team users from different areas, data experts, and IT professionals to develop insights and support a broader adoption rate.
- Data literacy: Help people understand data and teach them to judge its insights and use natural language features with ease.
- Embed augmented analytics strategically: Put augmented analytics in the areas and tools your team uses, so they can use insights without having to change where they work (this model of integration is called embedded analytics).
What is the difference between augmented analytics vs. automation?
Automation handles repetitive tasks, such as data entry and reporting, aiming to save time and reduce manual effort. Augmented analytics, on the other hand, uses AI and machine learning to uncover insights, assist decision-making, and enhance data analysis. While automation focuses on doing tasks, augmented analytics focuses on understanding and improving decisions.How does machine learning & auto ML in augmented analytics work?
Machine learning (ML) and automated machine learning (AutoML) are the engines behind augmented analytics. Here’s how they work:Machine learning (ML)
ML algorithms analyze large datasets, spot patterns, and learn from the data without being explicitly programmed. In augmented analytics, ML helps:- Detect trends and anomalies
- Make predictions (like sales forecasts or customer churn risk)
- Recommend next actions or insights
AutoML
AutoML takes care of building, training, and fine-tuning your machine learning model on your behalf. Now, instead of a person having to choose and tune algorithms, AutoML completes it automatically.- Data preprocessing (cleaning, transforming data)
- Model selection (choosing the best algorithm)
- Hyperparameter tuning (optimizing performance)
- Model evaluation (checking accuracy and reliability)
Why is augmented analytics key for success today?
 The increase in availability of augmented technology is key to understand today because it provides a far more pervasive level of adoption of analytics across the business.
Augmented analytics tools can transform the data preparation, discovery and explanation process, and open up new ways of exploring and interpretation of data.
Enabling your organization with the benefits of automated insights, utilizing machine learning and natural language for querying and exploration also doesn’t just make it easier for users or customers to consume, analyze and act on data – it gives you a competitive advantage and eliminates the risk of being left behind.
Many businesses are only now starting on their augmented analytics journey, even though this technology has been available and accessible in a number of modern BI platforms. Those who have invested in augmented have achieved significant benefit by embracing automation into their end-to-end analytics workflows. Not only have these organizations established themselves as trailblazers (when implemented successfully), they've also secured an early advantage in future proofing their analytics strategy.
The increase in availability of augmented technology is key to understand today because it provides a far more pervasive level of adoption of analytics across the business.
Augmented analytics tools can transform the data preparation, discovery and explanation process, and open up new ways of exploring and interpretation of data.
Enabling your organization with the benefits of automated insights, utilizing machine learning and natural language for querying and exploration also doesn’t just make it easier for users or customers to consume, analyze and act on data – it gives you a competitive advantage and eliminates the risk of being left behind.
Many businesses are only now starting on their augmented analytics journey, even though this technology has been available and accessible in a number of modern BI platforms. Those who have invested in augmented have achieved significant benefit by embracing automation into their end-to-end analytics workflows. Not only have these organizations established themselves as trailblazers (when implemented successfully), they've also secured an early advantage in future proofing their analytics strategy.