

15 Benefits of BI Dashboards That Make Work Easier
Business intelligence (BI) dashboards, also known as BI dashboards, are a powerful way to help people collect, share and analyze their business data to make informed decisions.
Business dashboard software can help users monitor operations, optimize processes, and improve overall business performance by having data readily available, and can also help detect and prevent potential problems before they become issues with its use of real time data.
With the proper implementation and software solution, there are several business intelligence dashboard benefits that organizations can unlock for better data-led decision-making across the board. In this blog, we detail 15 of the most common benefits of BI dashboards.
BI dashboards: A refresher
Business intelligence dashboards aggregate and display data in a visualized overview that can be used to analyze and improve performance. They can be used to track and monitor key business metrics, such as sales, customer churn, and employee productivity.
Business users, such as sales managers, can leverage BI dashboards to quickly and easily see trends and correlations in data. This can help many people across the organization have easier access to critical data, make better decisions and improve performance.
The proliferation of self service BI solutions in the past decade has opened up the availability of dashboards to regular, non-technical business people, and made it an essential tool to help them discover insights from real-time metrics, and inform their decision-making. But there's more benefits to using dashboards than just this - and to understand them, we briefly need to examine the core elements of BI dashboards that make these advantages possible..
Related reading: 4 Key Features of a Modern BI Dashboard
What are the key elements of a BI dashboard?
The successful implementation of business intelligence dashboard management consists of fundamental elements that enable users to make quick and informed decisions. Here are the key elements of a BI dashboard that help businesses with better decision-making:
- BI data visualizations which include charts, graphs, and maps, which transform complicated data information into visible trends through easy-to-identify patterns.
- Performance indicators are a key element of BI dashboards, which enable users to monitor progress toward business goals through measurable metrics.
- Interactive filters provide users with a way to analyze data through dynamic variable adjustments encompassing time intervals and geographic locations or business departments.
- With data source integration, users can monitor integrated data originating from ERP, CRM, spreadsheets, and API tools in one unified view.
- Drill-down capability, where users have the ability to start from high-level summary information and then move into more in-depth details.
- Real-time updates ensure that operational dashboards use live data that always displays the latest, correct information.
- Narrative features which are available in certain BI software solutions enable data stories to be integrated within a dashboard to provide further contextual explanations about changes in data, along with their underlying motivations.
The best business intelligence tools provide dashboard suites that include all of these core elements, and enable the following top business benefits to be unlocked for organizations.
Read more in-depth: The Critical Elements of Effective BI Dashboards
What are the top business benefits of BI dashboards?
A dashboard brings a number of key advantages for organizations when used correctly, such as the ability to monitor, visualize and take faster, informed action on real-time metrics. We break down the top 15 benefits in the section below.
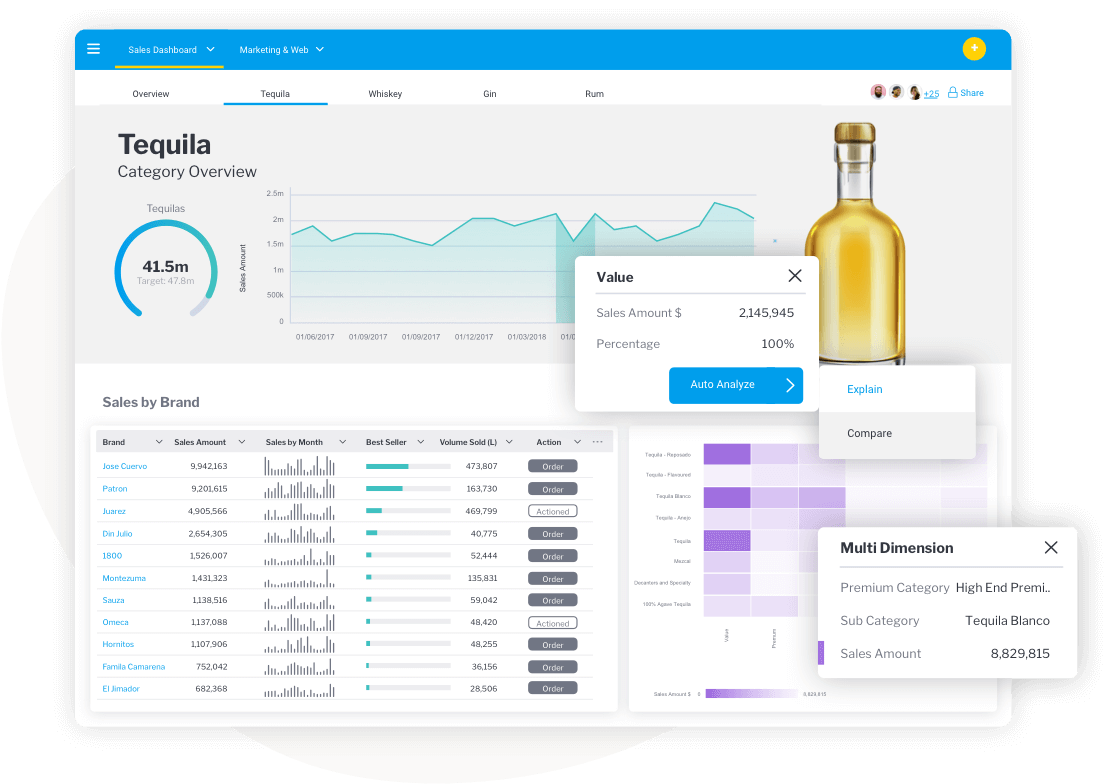
1. Communicating business critical information at-a-glance
Data sources can provide valuable insights into your business operations, but it can be difficult to understand and analyze the data in a timely manner. BI dashboards can help you quickly and easily access critical information you need to make informed decisions.
A BI dashboard additionally allows for visualization of data in a way that makes information easy to understand and allows for quick comparison of different aspects of your business. Data visualizations such as charts and graphs can help you identify trends and patterns that may otherwise be difficult to see when viewing raw data (tables or numbers) alone.
Trends, sales data, and customer information can all be easily monitored and analyzed using BI dashboards, too, helping you make better decisions and improve your operations. The best business intelligence dashboard software can quickly enable these capabilities for your company or unique use case.
2. Tracking and executing on KPIs
Key performance indicators (KPIs) are important tools that can help you track the progress of your business. BI dashboards can help you easily view and analyze data related to your KPI goals, and many organizations today specifically create KPI dashboards for that reason.
KPIs help you identify areas where your business is performing well and identify areas where you need to improve. Having this information available at a glance in a well organized dashboard can help you make informed decisions and better manage your resources.
Having KPIs updated in real-time on a KPI dashboard can also be used to measure the effectiveness of your marketing and sales efforts, without the typical constant need to refresh reports.
3. Empowering users with better accessibility to information
BI dashboards let users get a better understanding of the business data by making it easier for them to find and access information.
Real-time data visualization tools help users see patterns and trends that they may not have been able to see before. This can help employees make better decisions and improve the efficiency of their work.
Users can also use BI dashboards to monitor their own performance and track changes over time. This can help businesses to identify areas of improvement and make necessary changes.
An effectively designed business metrics dashboard ultimately enables quicker, easier accessibility to real-time information for users who depend on data for awareness and daily or regular decision-making - which leads us into our next dashboard benefit.
4. Achieving true data-driven decision-making
A BI dashboard can help you quickly and easily see patterns in your data that you may not have seen before. This can help you make better decisions faster, by helping you identify issues and opportunities earlier.
Looking for trends in your data can help you identify potential problems and opportunities, and can help you make informed decisions about where to allocate your resources. The extent, of course, that a dashboard is able to help users detect patterns and correlations depends on their deployment of advanced capabilities, like automation.
5. Identifying changes, outliers and trends quicker
A BI dashboard can help businesses to identify changes and trends more quickly. This can help them to identify potential problems and make necessary adjustments before they become major issues.
BI dashboards also create a more comprehensive picture of the business, which can help to identify any outliers or anomalies. This can help businesses to make better decisions and save money in the long run.
Being able to see changes, patterns, and trends in business data relatively quickly and easily is one of the key business benefits of BI dashboards that can contribute to maintaining a competitive edge. It helps identify changes in the initial stages of business operation to make better data-driven decisions and avoid potential pitfalls.
6. Trusted, verified data sharing
BI dashboards can help to create a trusted data-sharing environment. This can help to ensure that all data is accurate and up to date.
Analytics can also be used to track the performance of individual departments and identify areas of improvement. This information can then be used to make decisions that will improve the overall performance of the business. In summary, using trusted business intelligence tools allows organizations to maintain data consistency across departments.
7. Intuitive reporting and analysis
BI dashboards allow users to quickly and easily generate reports and analyses. This makes it easy for managers to get a quick overview of the business data and make informed decisions.
Reports can also be customized to meet the specific needs of the business. This allows managers to get the most out of the data and make better decisions. This customization also allows users to create business intelligence dashboards that are specific to their own needs.
8. Increased efficiency and visibility of business processes
Interactive dashboards ultimately help businesses to identify areas of improvement and make necessary changes. By understanding how the business works as a whole, businesses can become more efficient and improve their overall performance.
Combined with data storytelling tools (dependent on the BI solution's support of data stories), which employs narrative with data to convey the bigger picture and explain the what, when, why and how behind the data, businesses can better see how changes in one area impact other areas, the context of the data, and the overall performance of the business.
9. Customizable user interface (UI)
Users can personalize their BI dashboards through a flexible UI that enables them to design interfaces that match their needs and work routines. The best BI solutions offer dashboards with highly customizable user interfaces that improve the ease of use of data by presenting the most important metrics of a particular team, department, or project at the forefront.
The customization of layout formats, combined with distinct color schemes and widget adjustments, can help organizations encourage users to become more involved with dashboards and what they can do for their day-to-day workflows and decision-making.
10. Interactive data visualizations
Interactive data visualizations make complex information easier to understand by turning raw numbers into charts, graphs, and maps you can explore. Instead of just looking at data, users can click, filter, and dig deeper to spot patterns and insights that might otherwise go unnoticed.
Business intelligence tools like Yellowfin BI make this even easier by combining a rich assortment of visuals with in-built data storytelling features, which helps everyone, from team members to executives, better understand the context behind the data using charts and graphs that simplify complex metrics into digestible formats.

11. Mobile dashboard accessibility
BI dashboards can be observed and modified through mobile platforms such as smartphones and tablets because of their accessible characteristics. The ability to stay updated and responsive as a decision-maker remains possible through on-the-go mobile access to business intelligence dashboards, even when away from office workstations.
BI solutions like Yellowfin provide mobile BI device support for dashboards, opening up accessibility to key business metrics, at-a-glance, to a broader audience. Operation speed and flexibility within business operations improve since dashboards enable real-time data access and support immediate action through mobile optimization features.
12. Advanced analytics and reporting
Advanced analytics incorporates predictive models, trend analysis, and historical data comparisons into BI dashboards. This allows businesses to forecast outcomes, spot risks, and identify opportunities.
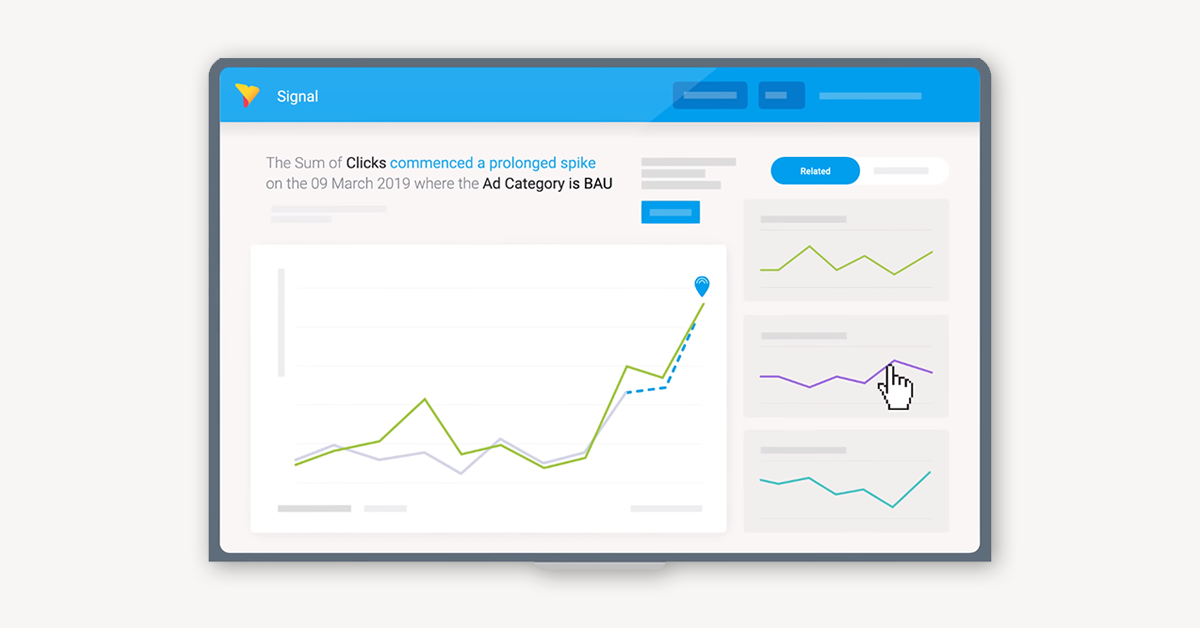
Automated reporting tools, such as Yellowfin Signals, further boosts efficiency by delivering timely insights to stakeholders without manual intervention by automatically monitoring and then alerting analytics users of statistically relevant changes in their data, which can be viewed via the same BI dashboard. These enhancements are only made possible through modern business intelligence tools that combine usability with complex analytics capabilities.
13. Multi-source data integration
The support for multiple data sources within BI dashboards enables them to merge information from CRMs and ERPs as well as spreadsheets and APIs into one interconnected display. The standardized method unites different data sources, while enhancing consistency and bringing forth all available correct information for decision-making purposes.
14. Augmented analytics features
The implementation of generative AI and machine learning technologies into modern analytics solutions brings business intelligence dashboards that help produce more intelligent insights using advanced capabilities such as generated predictive forecasting and natural language query (NLQ). These technologies fall under the banner of AI analytics (also called augmented analytics) and help reveal irregularities in datasets, and further simplify the exploration and analysis of data for a broader audience of analytics users (non-technical and advanced alike).
One such example is Yellowfin's AI NLQ feature, which allows analytics users to type a question of their data using free-text as they would in any search engine, and have the BI solution structure the question on their behalf with the proper syntax automatically before generating a best practice visualization or report that can be directly imported into a BI dashboard. You can watch a video of AI NLQ in action below.
15. Easy data export and integration with other tools
Users can export data through a simple process that allows them to select PDF, CSV, or Excel file formats for seamless data sharing with both online and offline analysis possibilities. BI dashboards integrate with collaboration tools through Slack, Teams, etc, and project management platforms to streamline daily work processes by expanding the use of business intelligence tools, thereby enhancing collaborative efficiency. Yellowfin BI offers an in-built data export tool called Yellowfin Export.
Learn more: What is Yellowfin Export? How to Share Reports & Dashboards
How to create business Intelligence dashboards?
Getting started with creating and designing BI dashboards has become easier with modern business intelligence solutions such as Yellowfin, which offer sophisticated dashboard tools tailored for both non-technical and advanced analytics users.
The best BI dashboard tools allow organizations to create dashboards using the following flexible and clear processes:
- Integrate information easily: The best analytics solutions offer connection tools (connectors, API, etc) that enable easy integration of business information stored in databases, and connectivity with other popular data formats such as spreadsheets, CRMs, ERPs, and cloud platforms.
- Drag and drop option: Modern BI dashboard solutions allow users to design dashboards using low-code, drag-and-drop tools along with visual widgets and KPI tiles to create highly personalized layouts.
- Data filters and drill paths: The application of filters, together with drill paths, promotes user exploration and development in data insights.
- Convert data into actionable insights: The system includes action buttons that help users convert data into actions while speeding up their workflows.
- Data storytelling features: Users can utilize data storytelling features that provide explanations of trends alongside anomalies.
- Easy and secure sharing: The system allows users to share business intelligence dashboards securely, either through internal team connections or application links and external platforms.
For more information and a step-by-step guide with pictures, we recommend reading How to Create a Dashboard in Yellowfin: Step-by-Step Guide.
What’s the difference between BI dashboards and BI reports?
BI dashboards are a visual overview of critical business metrics collated on a single screen, updated in real-time - for example, a KPI dashboard. They are best used as a quick summary and update of what’s going on in the business at-a-glance.
In comparison, BI reports are a static snapshot of business performance at a single point in time. These types of reports are traditionally more detailed than dashboards, combining text, data visualization, and tables for more detail into a particular segment of data. Because it is static, it is not updated in real-time, making it better suited for business analysis and breakdown of certain data sets in a particular time frame.
Related reading: Dashboard vs Report - Which is better for BI?
Best practices for creating BI dashboards
The effective implementation of a business intelligence dashboard needs both user-friendly and useful aspects to achieve the purpose of the tool:
- Before creating dashboards, establish the specific questions they need to solve.
- Customized views should match the roles and responsibilities of your audience during the design phase.
- The visuals should be arranged to avoid clutter so users can easily recognize key trends.
- Include interactive elements that consist of filters, together with drill-down capability.
- Scheduled or real-time data update systems should be established to preserve information relevance.
- The system must provide contextual features that demonstrate how data values translate into meaningful information and their significance.
Closely following proper dashboard design principles will deliver ease of use and insightful understanding of business data among your audience, and ensure your business unlocks the many advantages of business intelligence tools listed in our blog.
Looking for the solution to your business data problems?
The problem with today's business data is that it is scattered all over different systems and is difficult to access, understand, and use.
A BI dashboard can help solve these problems by providing a centralized location for all your business data, and Yellowfin's BI Dashboards can help you get started.
With action-based dashboards, you can quickly and easily see the impact of changes to your data. Free-form, no-code or low-code, and drag-and-drop dashboards let you create powerful reports and visualizations quickly and easily.
Developers and data analysts can use BI dashboards to quickly and easily find patterns and insights in your data. This can help you make better decisions, improve your operations, and increase your business efficiency - some of the core advantages of business intelligence tools.
Conclusion
Through their database capabilities, BI dashboards convert business data into easily trackable, actionable insights. These tools enable business performance tracking of KPIs and support organizations to make quicker data-backed decisions. Dashboards optimize performance through real-time updates and customize visuals and multiple data source integration to enhance efficiency and data-dependent strategic choices.
Yellowfin provides modern businesses with simple design elements that guide users toward automatic insights through an interface that tackles complexity in data systems. Business organizations seeking complete value extraction from their data should implement BI dashboards because these tools provide intelligent and cost-effective solutions. Every organization that seeks performance enhancement from its data and needs expedited decision-making requires grasping the advantages of business intelligence tools.
Frequently Asked Questions (FAQs)
Do I need a technical background to use a BI dashboard?
Modern BI tools, including Yellowfin, provide an interface that all users can understand and offer no-code functionality.
What should I look for when choosing a BI dashboard solution?
Consider buying a user-friendly system that merges data, features interactive displays, shows real-time data, and expands its capabilities.
Are there any security concerns with BI dashboards?
There are some security concerns, but the trusted business Intelligence dashboards provide various encryption and role-based access that will help in keeping the data secure.
What are the common challenges in implementing a BI dashboard?
The main barriers to using dashboards include inconsistent data quality, resistance to adoption among users, complicated integration requirements, and difficulties making dashboard contents match established business targets.
Why are business dashboards important?
Business dashboards are important as they help the user to view their KPIs in real time and help in making informed decisions.
What are the main benefits of using a BI dashboard for business users?
BI dashboard gives business users instant access to real-time metrics, helping them understand performance, spot issues early, and make faster decisions. Dashboards centralize information from different sources into one visual view, reducing manual reporting and enabling every user—technical or not—to work smarter with data.
How do BI dashboards improve decision-making in an organization?
BI dashboards make decision-making easier by turning raw data into visual insights that reveal patterns, outliers, and trends at a glance. They help teams quickly identify risks, opportunities, and changes in the business, allowing leaders to take action sooner and base decisions on verified, real-time information instead of outdated reports.
Why are real-time dashboards important for business performance?
Real-time dashboards keep organizations informed with the most updated metrics, which is essential for reacting quickly to operational changes. Features like live updates and integrated data sources help teams detect problems before they escalate, improve efficiency, and stay competitive by responding to trends as they happen.
How do BI dashboards help track KPIs more effectively?
BI dashboards make KPI tracking effortless by displaying key metrics clearly and updating them continuously. This setup allows teams to view progress against goals, understand what’s working, and identify areas needing improvement without digging through spreadsheets. The visibility supports alignment and accountability.
What advantages do BI dashboards offer over traditional reports?
Unlike static BI reports that show past performance, dashboards provide real-time, interactive insights on demand. Users can drill down, filter, and explore data instantly, making dashboards far more useful for day-to-day decision-making. Reports remain valuable for deep analysis, but dashboards provide greater speed, clarity, and accessibility.
How do BI dashboards help identify trends and outliers faster?
Dashboards visualize large datasets through charts, graphs, and maps, making it easier to spot unusual changes or emerging trends quickly. Businesses use dashboards to catch anomalies early—whether in sales, customer churn, or operations—so they can understand the root cause and respond before issues grow.
What role do interactive visualizations play in BI dashboard benefits?
Interactive visuals transform complex data into easy-to-understand content that users can click, filter, and explore. This interactivity makes dashboards intuitive and engaging, allowing even non-technical users to uncover insights that would be difficult to find in raw numerical tables or static visuals.
How does mobile accessibility make BI dashboards more useful?
Mobile dashboards give decision-makers the freedom to access critical information from anywhere, ensuring responsiveness even when they’re not at their desks. Modern BI tools like Yellowfin support mobile optimization, allowing teams to monitor KPIs, review updates, and act on insights on the go.
How do BI dashboards improve efficiency across business processes?
By centralizing data and offering automated insights, BI dashboards reduce the time spent gathering information and preparing reports. They increase operational transparency, help teams identify bottlenecks, and support continuous process improvement through better visibility and real-time feedback.
What is the value of integrating multiple data sources into one BI dashboard?
Integrating data from ERPs, CRMs, spreadsheets, and APIs into a single dashboard eliminates silos and ensures users see a complete, accurate picture of business performance. This unified view leads to more consistent reporting, better collaboration, and more confident decision-making because everyone works from the same verified data.
Yellowfin BI Dashboard Solutions
Explore Yellowfin business intelligence dashboard software today and see for yourself how we can help your business, customers and application users become more data driven.