-
On-Demand Webinar: Securing and Governing Your Analytics Data with Yellowfin. Watch now
-
Yellowfin Named a Visionary for Third Consecutive Year in 2022 Gartner Magic Quadrant for Analytics & BI Platforms. Read more
-
2022 Gartner Market Guide for Augmented Analytics Read more
-
Check out what’s new in Yellowfin 9.8
-
Yellowfin Interactive Dashboard Gallery – See the world’s most beautiful dashboards in action. Explore
Dashboard Gallery
Explore our interactive dashboard and design gallery
For the full experience, please use a desktop browser to view this page.
Abrigo
This Abrigo dashboard delivers financial and loan data at both a KPI and operational level. The unique design capability within Yellowfin Canvas is utilized to create a dashboard that is easy to use and understand.
Customer Example
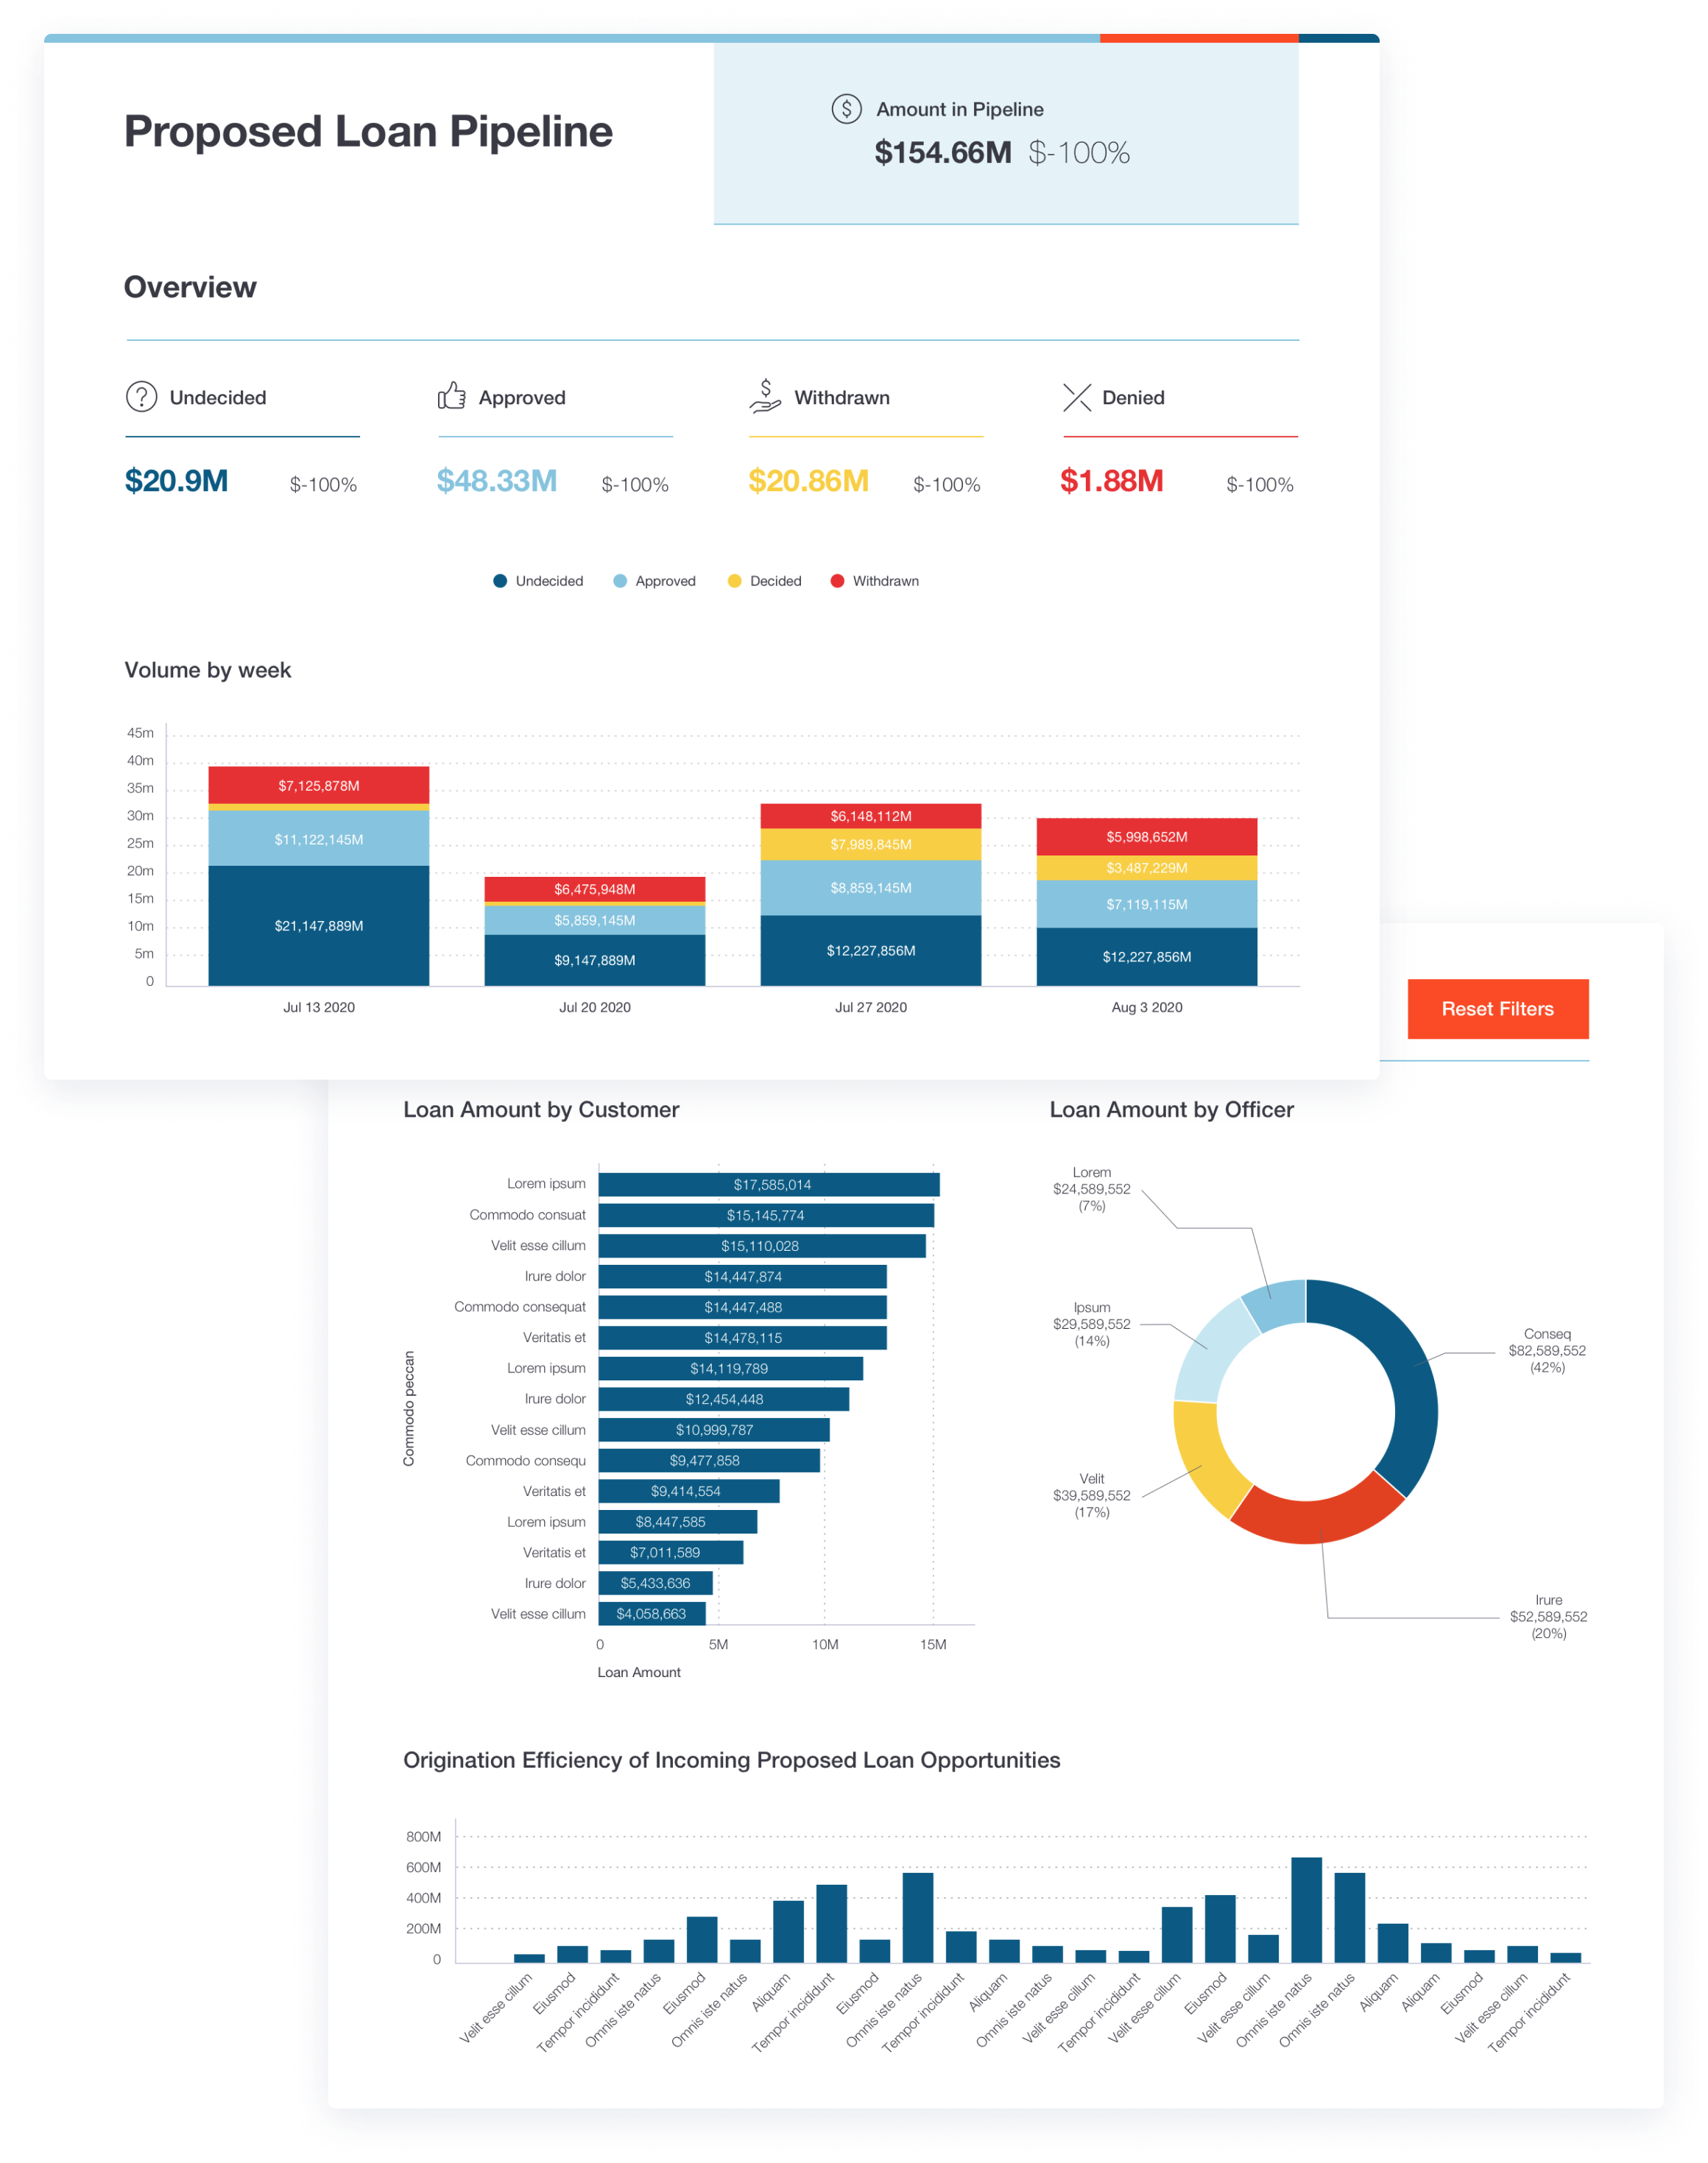
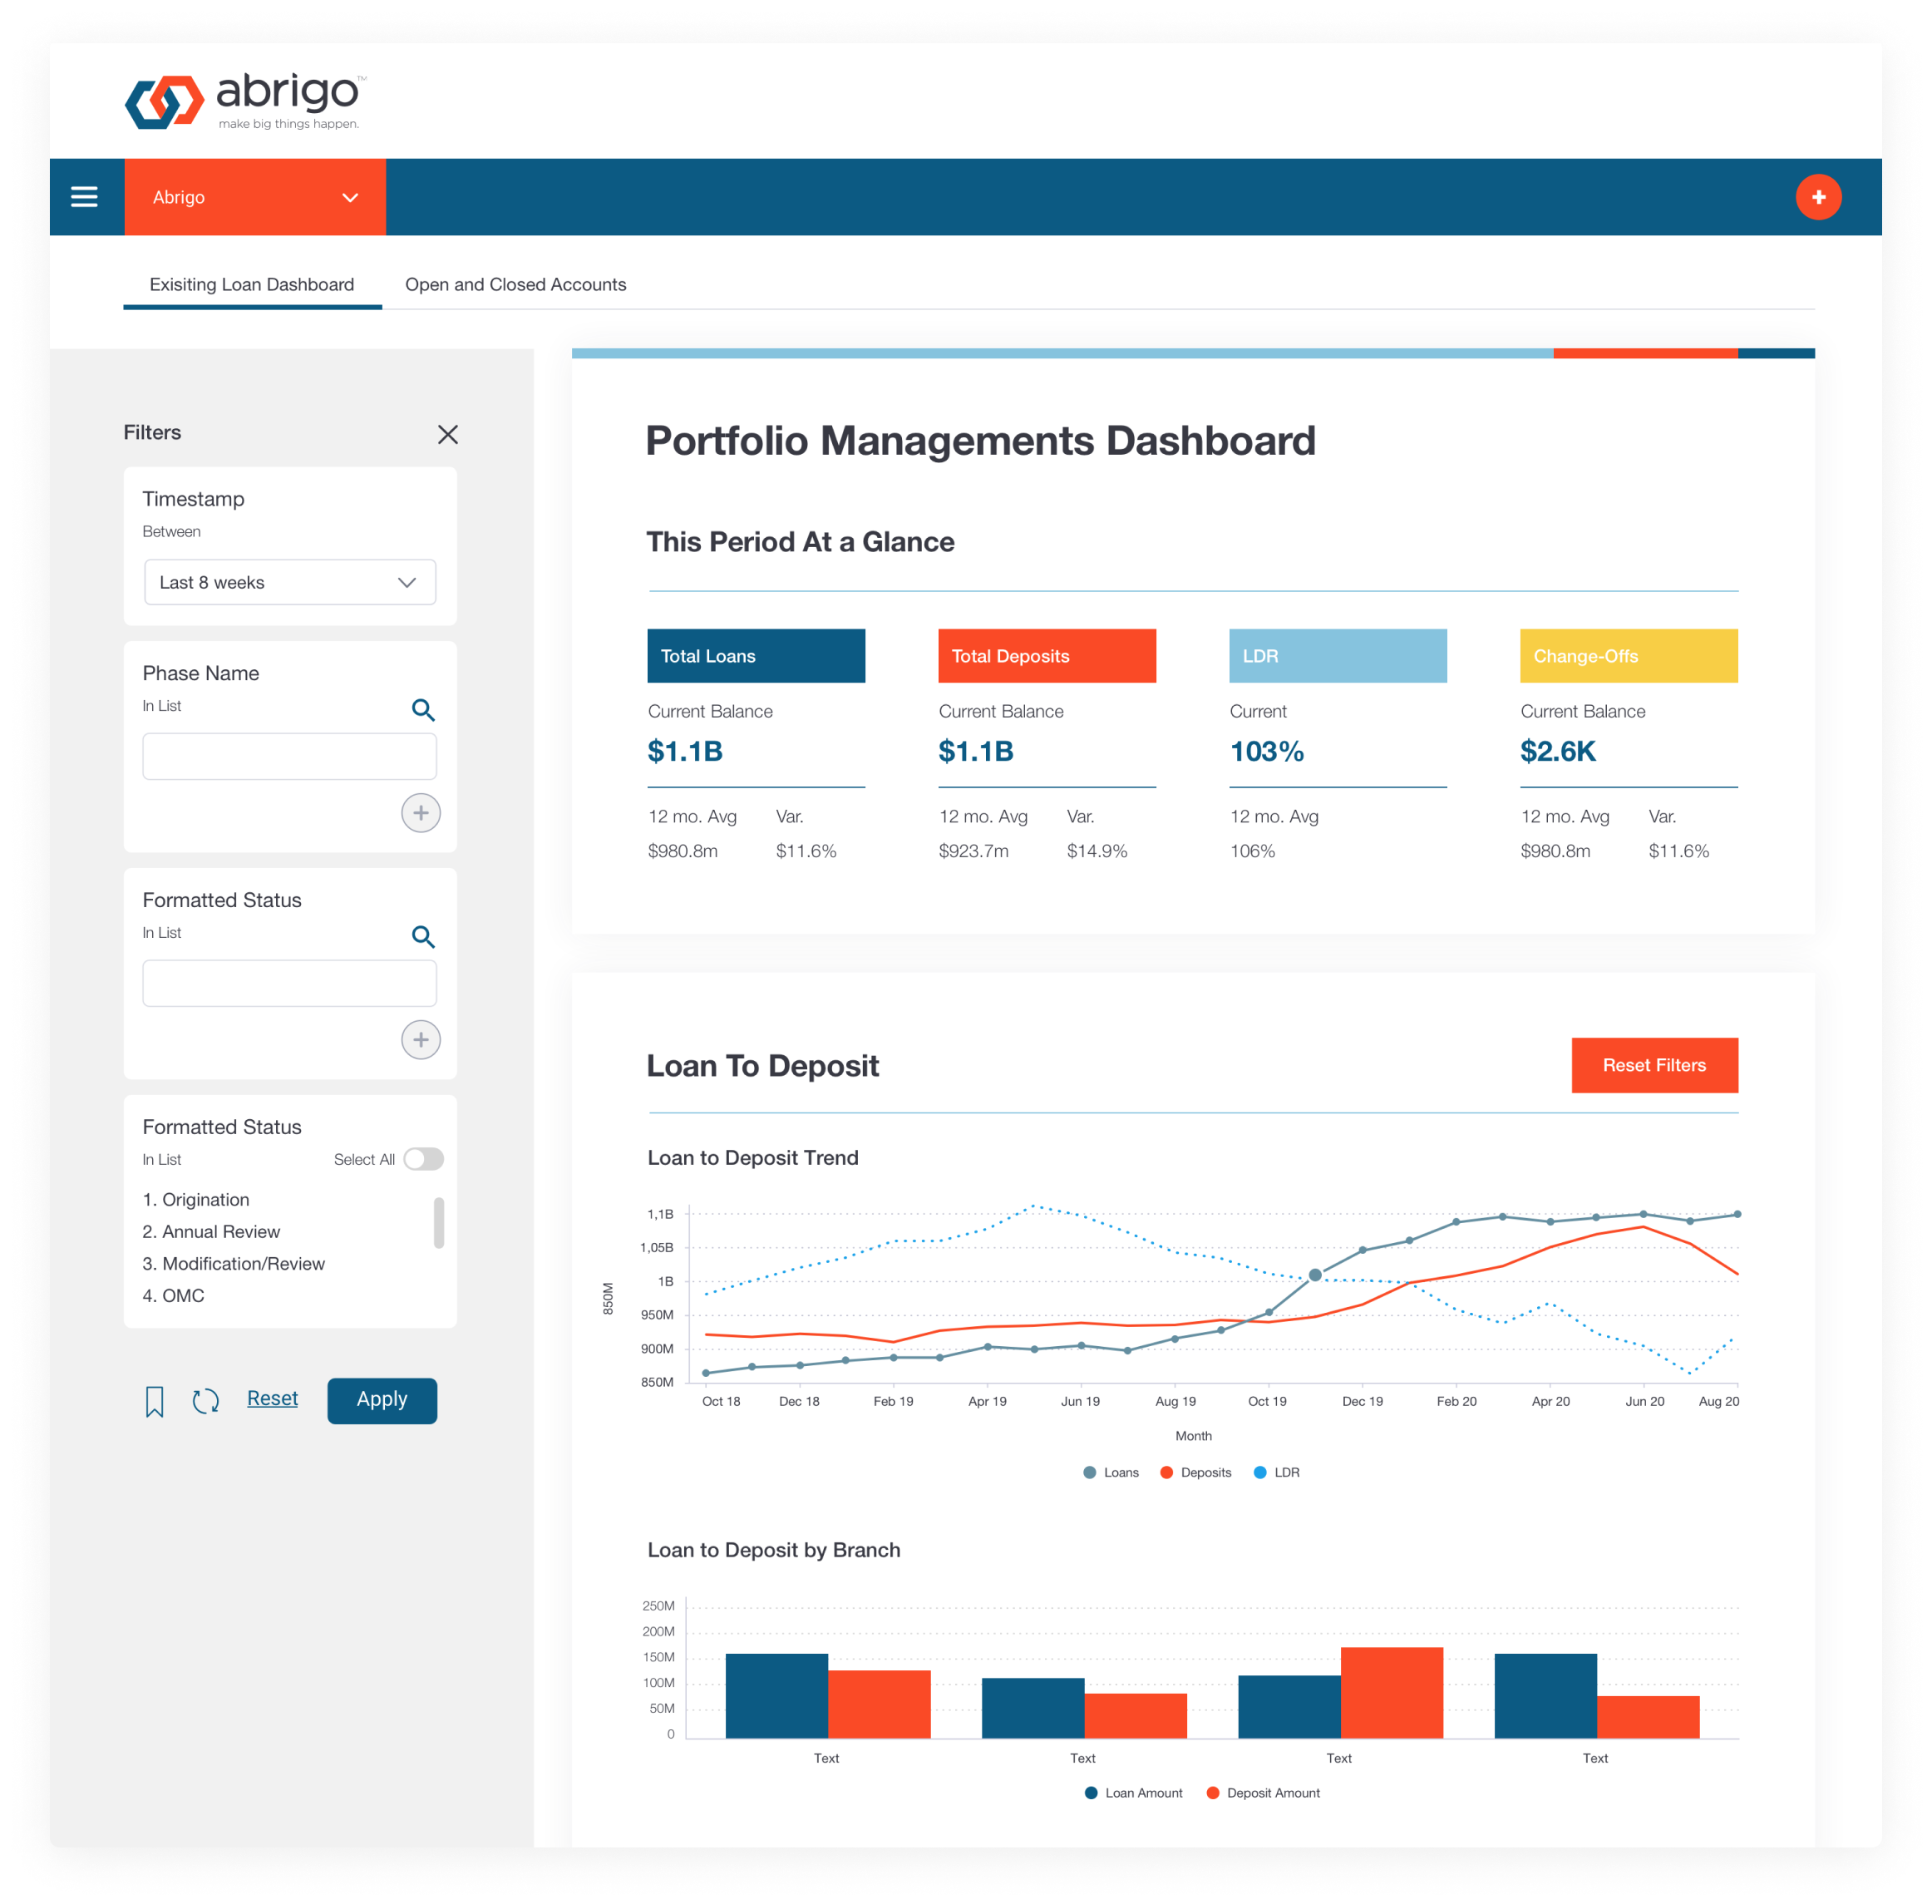
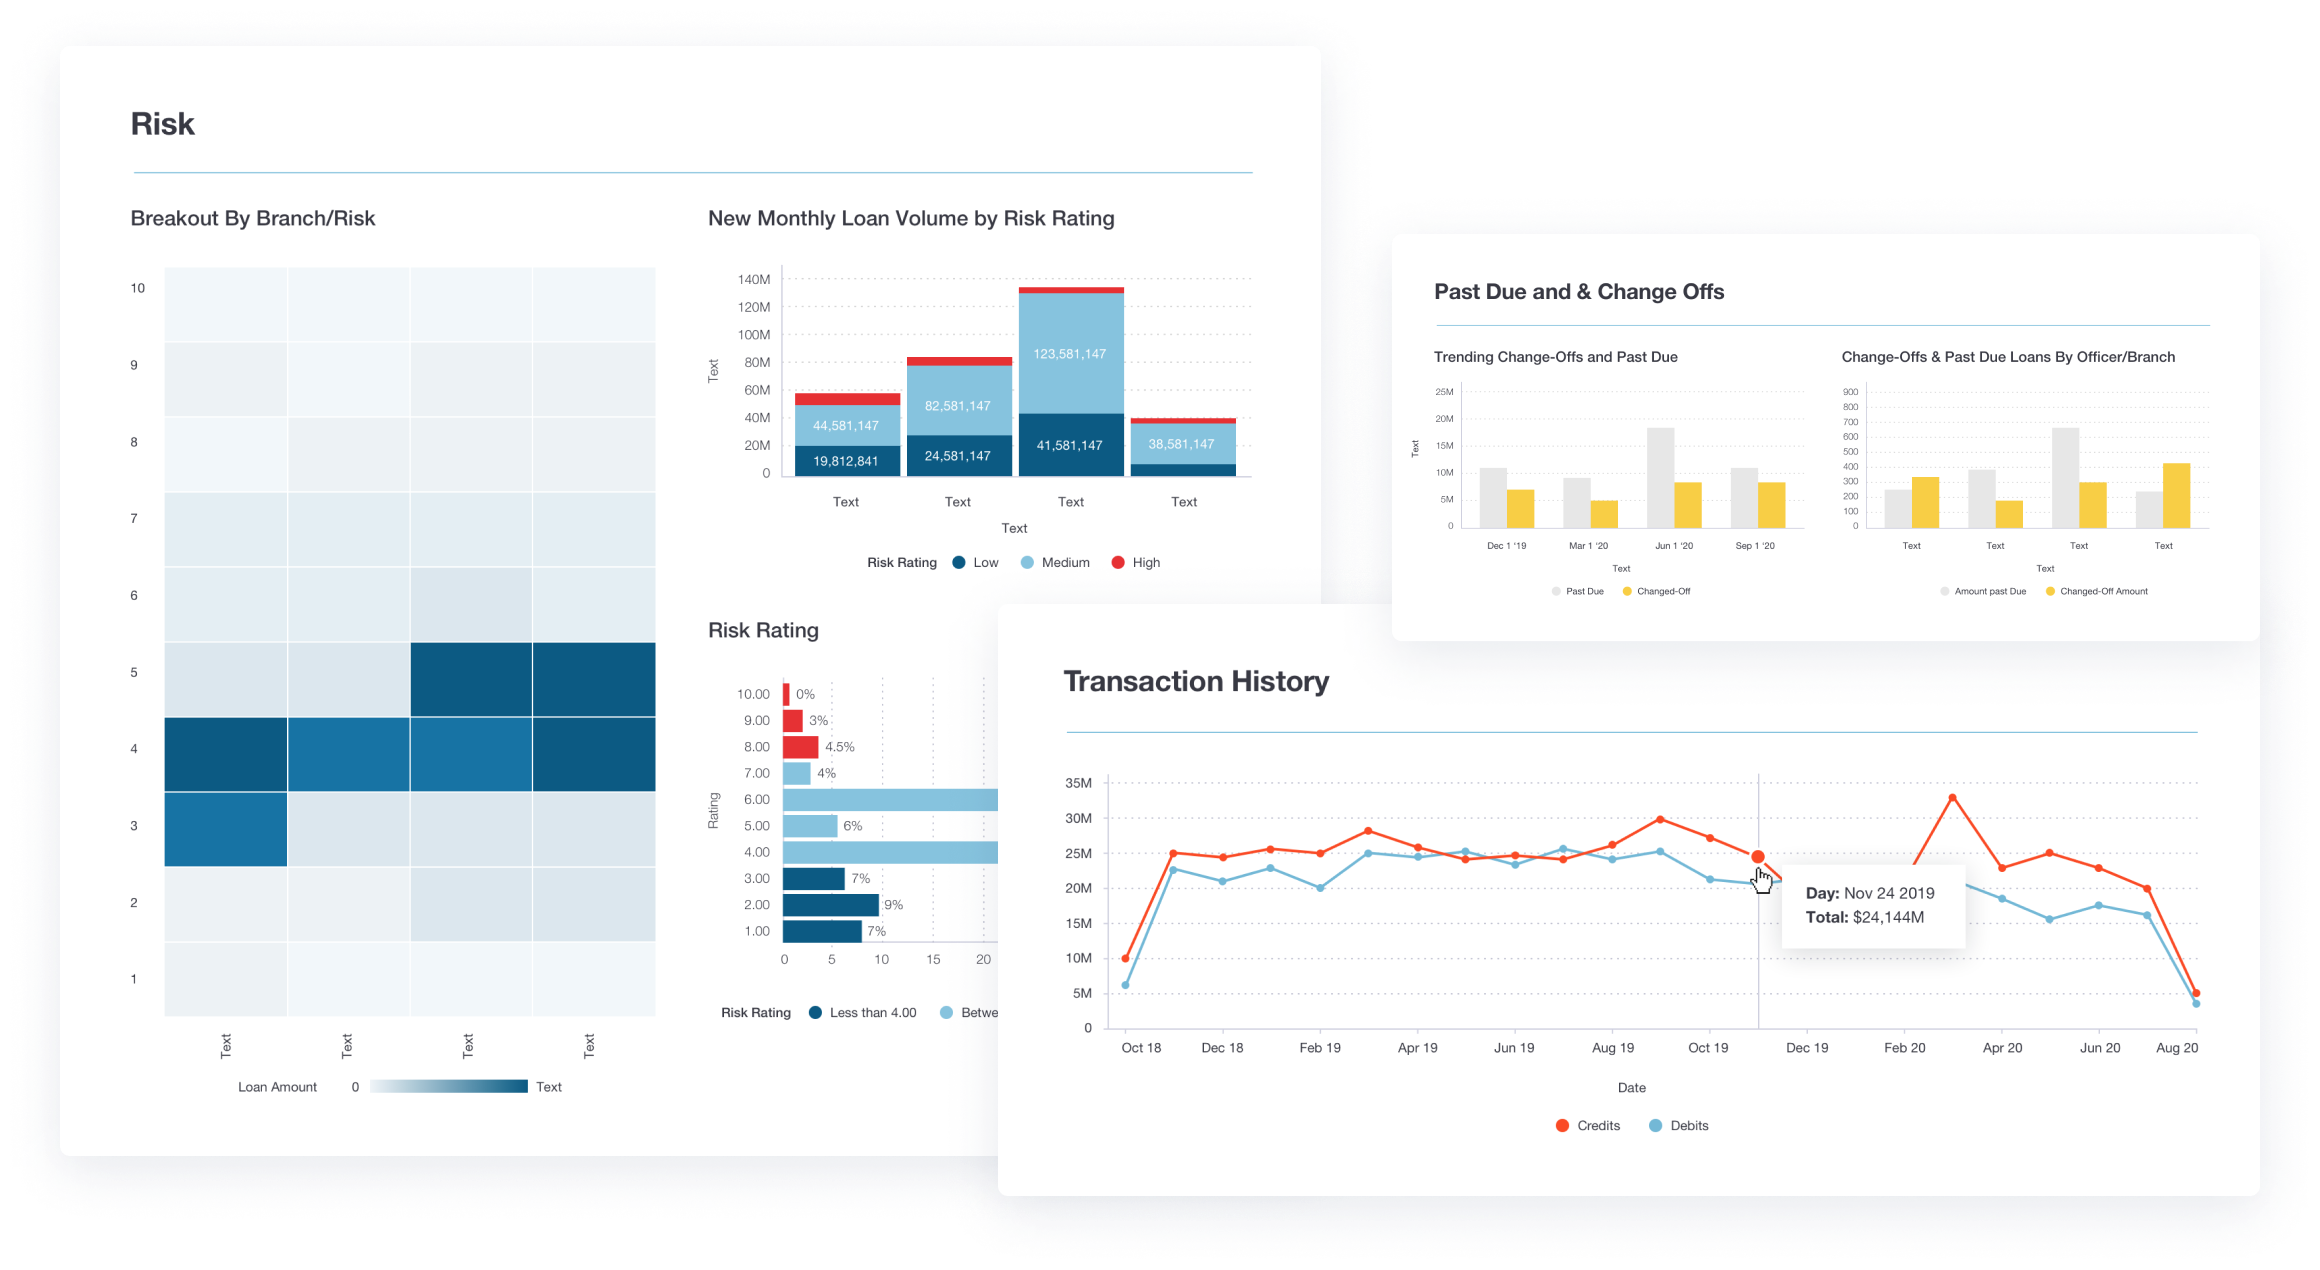
This includes clear typography, background shapes, drop shadows and graphic elements to group and highlight related data and visualizations. The flexibility of a free-form canvas combined with pixel-perfect control over dashboard components ensures the elements within are cleanly aligned.