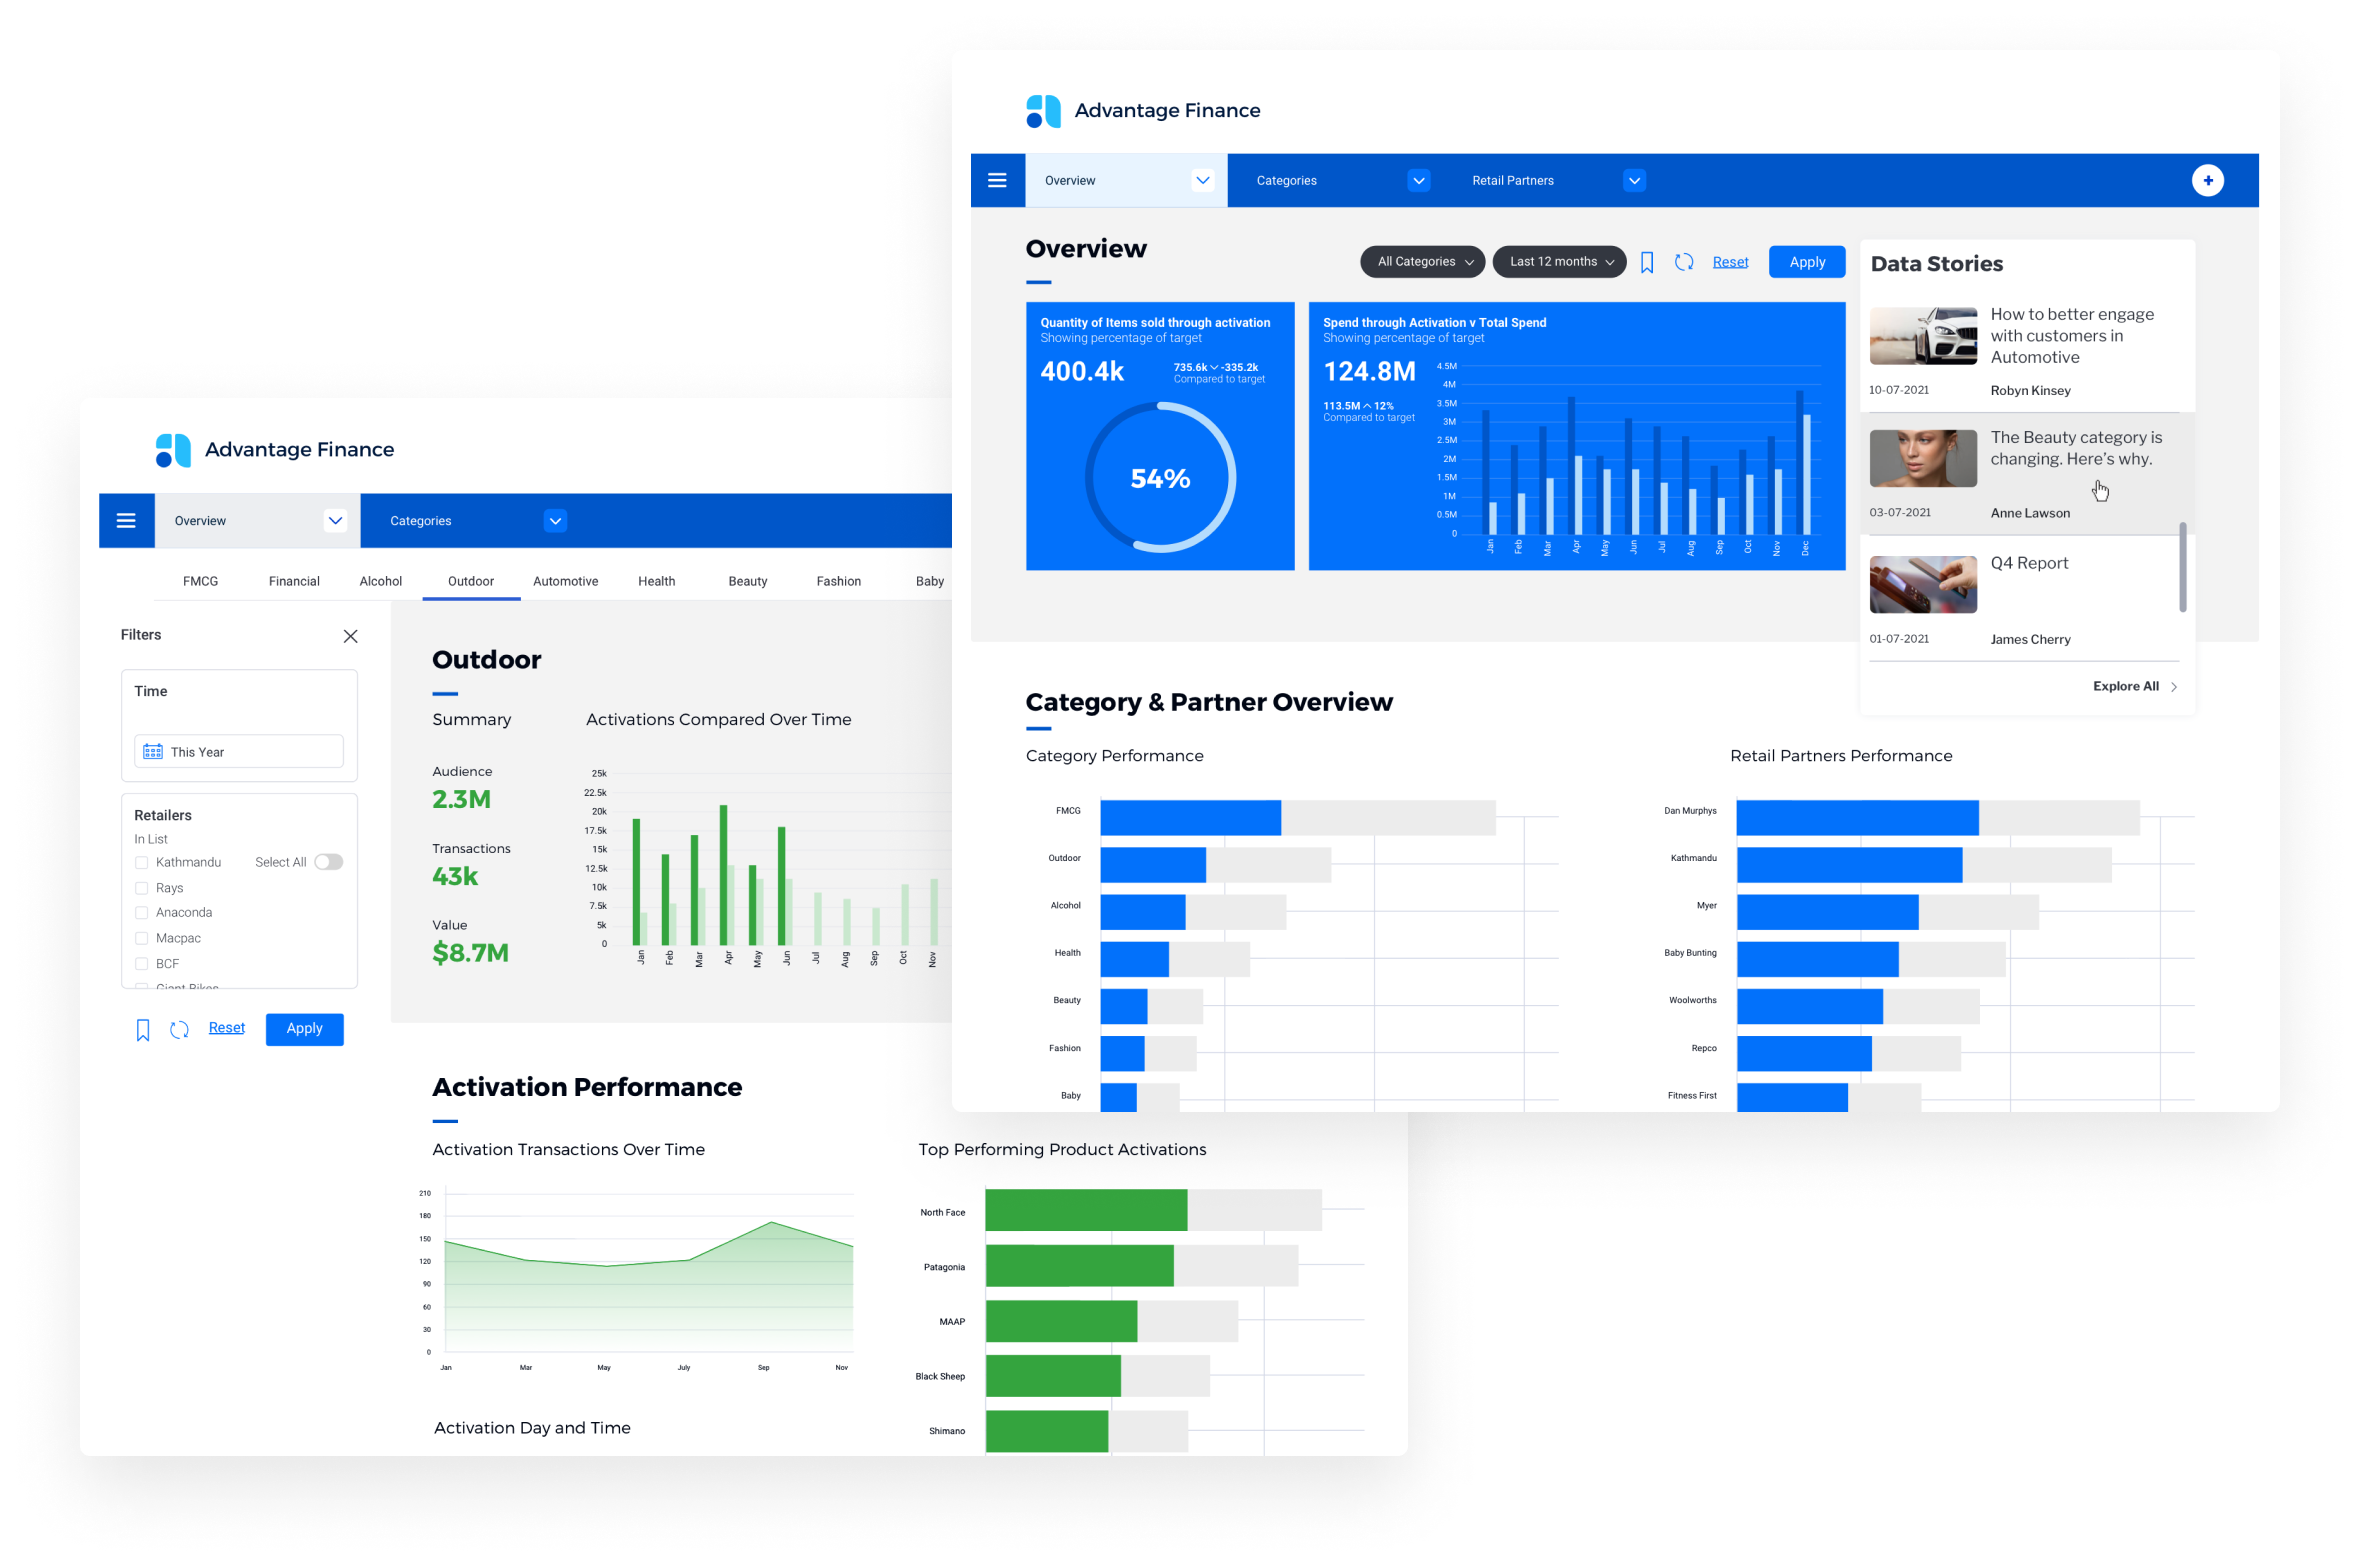
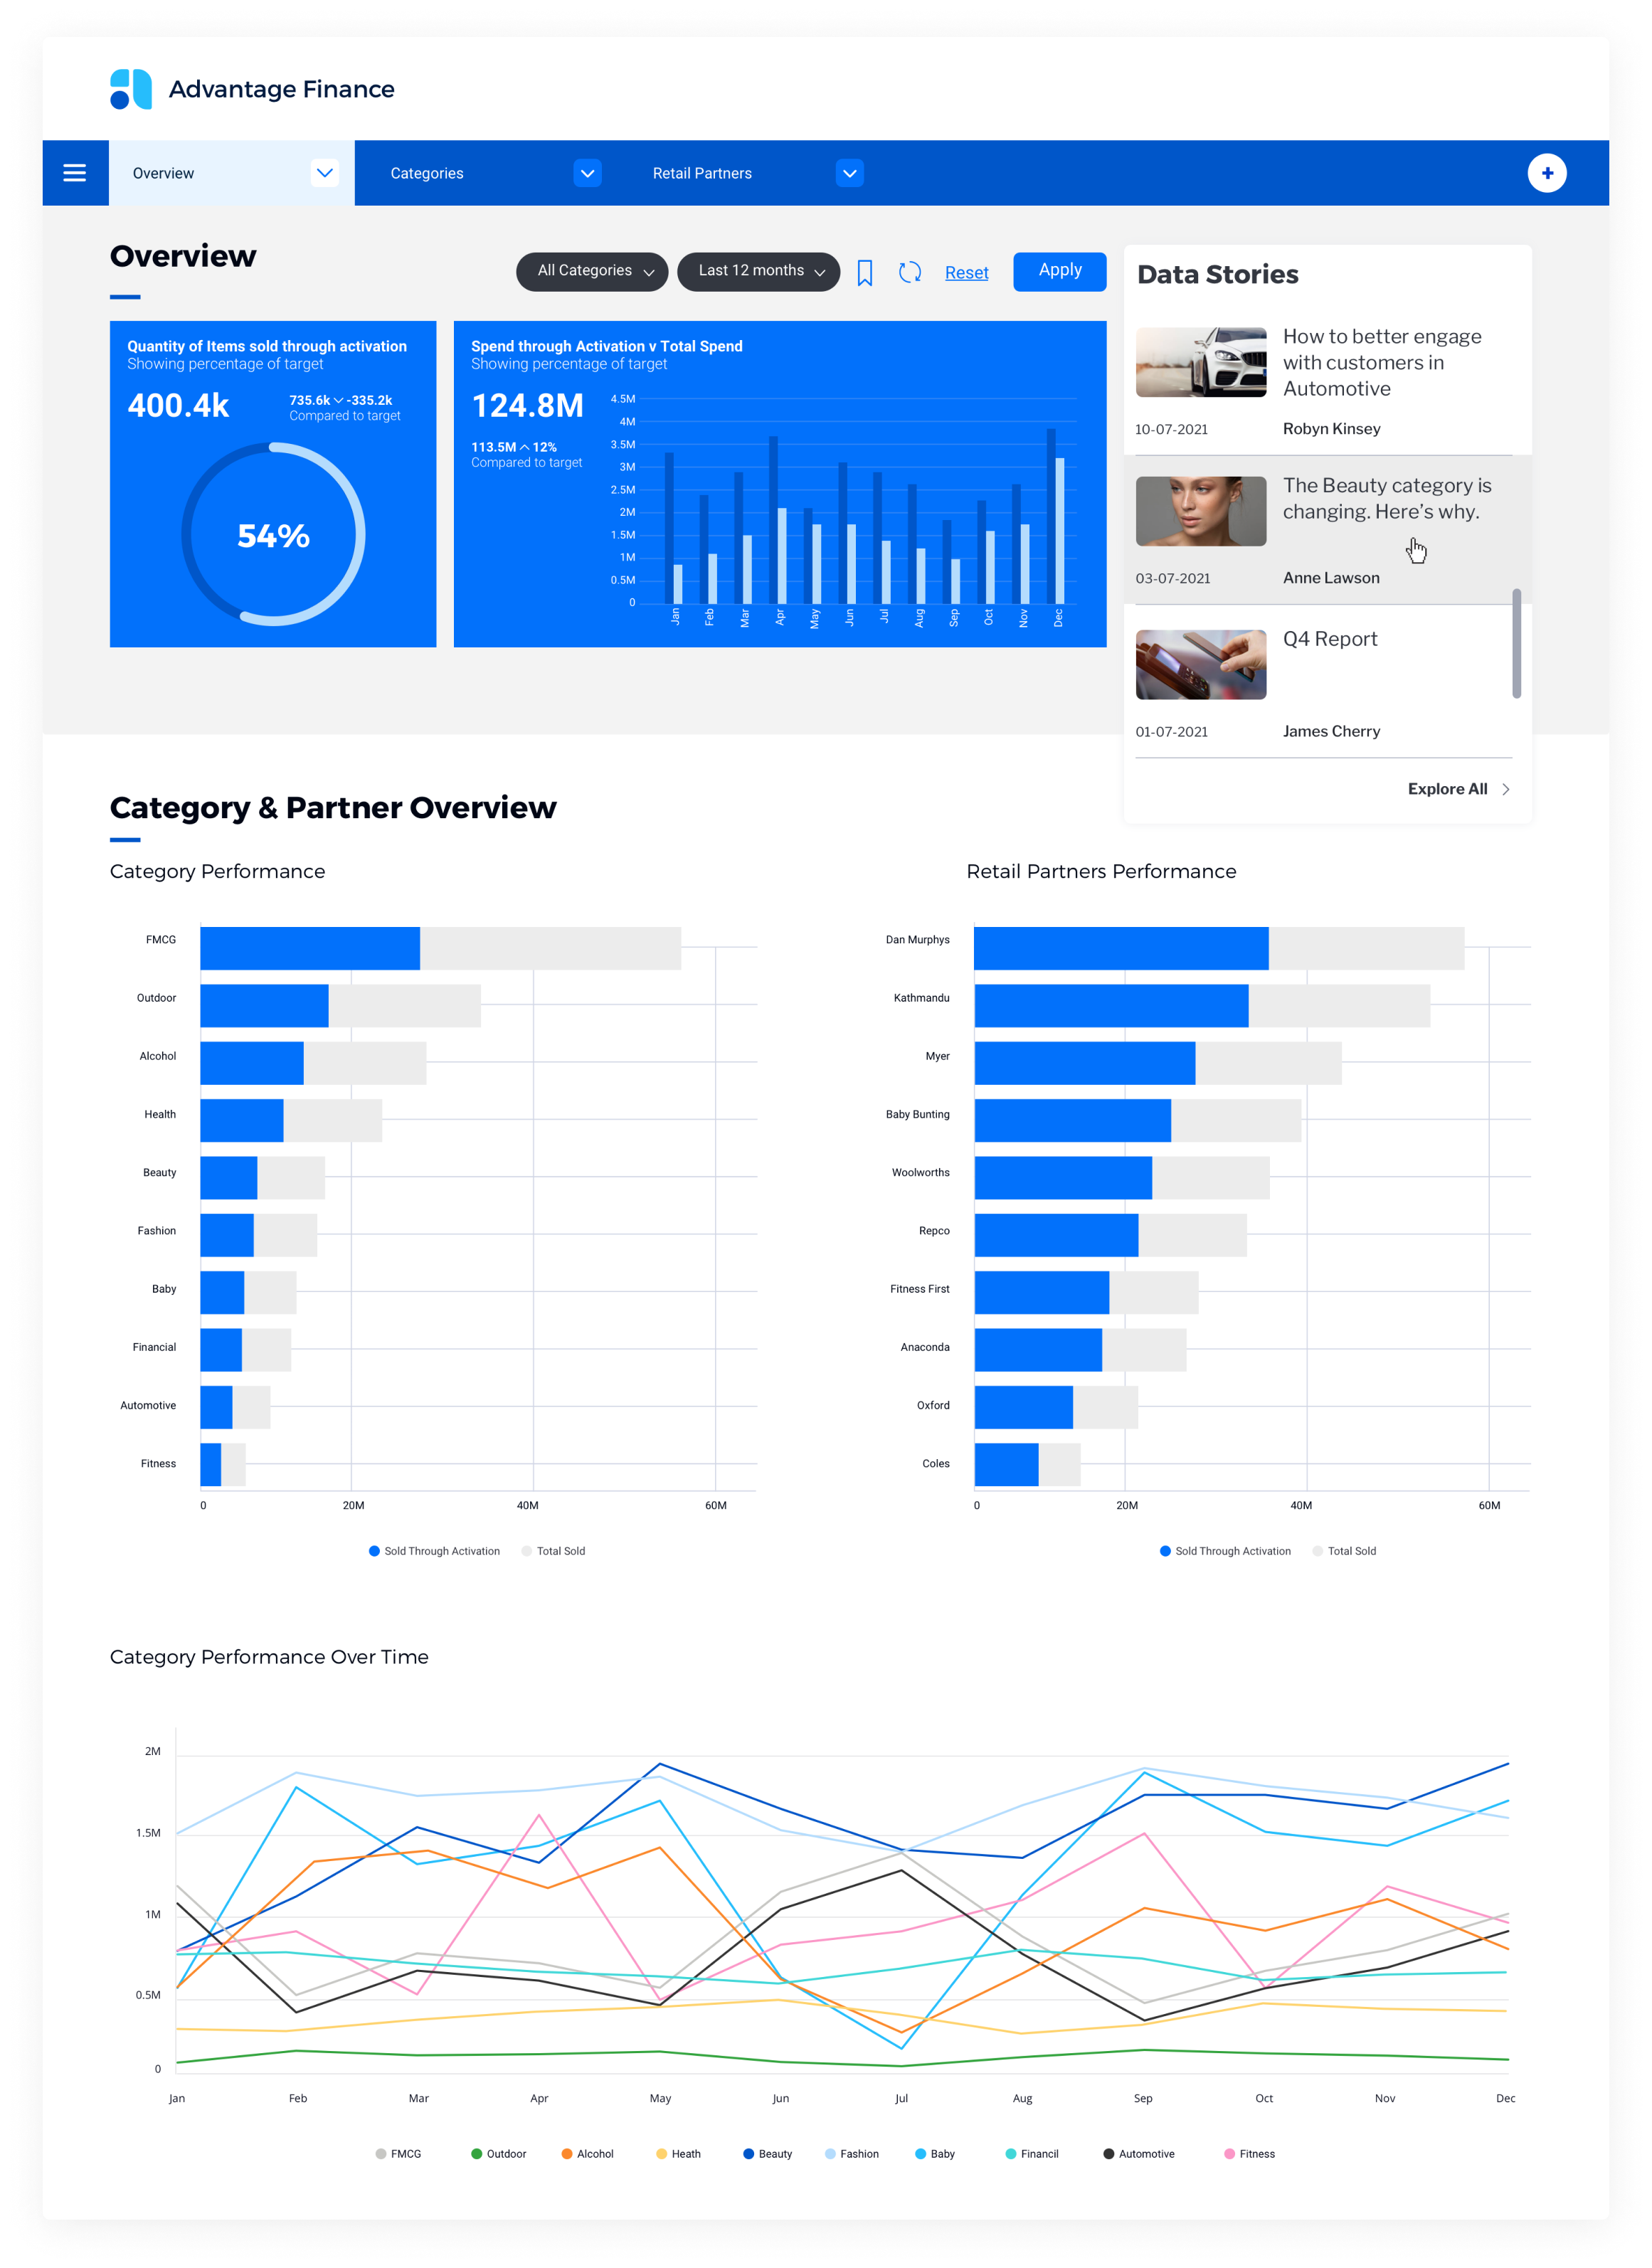
Divided across a number of sub-tabs, the dashboard starts with a high-level KPI overview of all activity with then allows users to explore each retail category within its own dashboard. Colour, typography and graphic elements are utilized to guide the viewer through the mix of data to ensure the data is understood and acted on. Easy-to-digest visualizations including heat maps, compare charts and line charts bring the data to life and tell a compelling story. The dashboard also makes use of Yellowfins unique data storytelling and automation functionality with the Yellowfin Story and Yellowfin Signals widget being used across the array of dashboards.