
Yellowfin 7.4 revolutionizes how you get data insights and helps you discover the ‘Why’
What if you could understand why your metrics have changed without putting in hours of extra work digging deeper into your analytics?
Or without having to even create your own charts? Or without doing anything more than a couple of clicks in Yellowfin to get an automatically generated chart complete with explanations and why changes have happened?
You can with Yellowfin 7.4.
You get assisted insights and the ability to transform your data within the same platform to help you get to the bottom of your metrics.
“Sounds great,” you say. “But what are assisted insights and how do they work?”
It’s almost magic.
It’ll save you hours.
Assisted insights to get you to the ‘Why’
Get charts served up instantly with Assisted Discovery
You have a business question and you want to get to the answer faster than ever before. You now can by letting Yellowfin do the heavy lifting and automatically generate the possible visualizations on your chosen data.
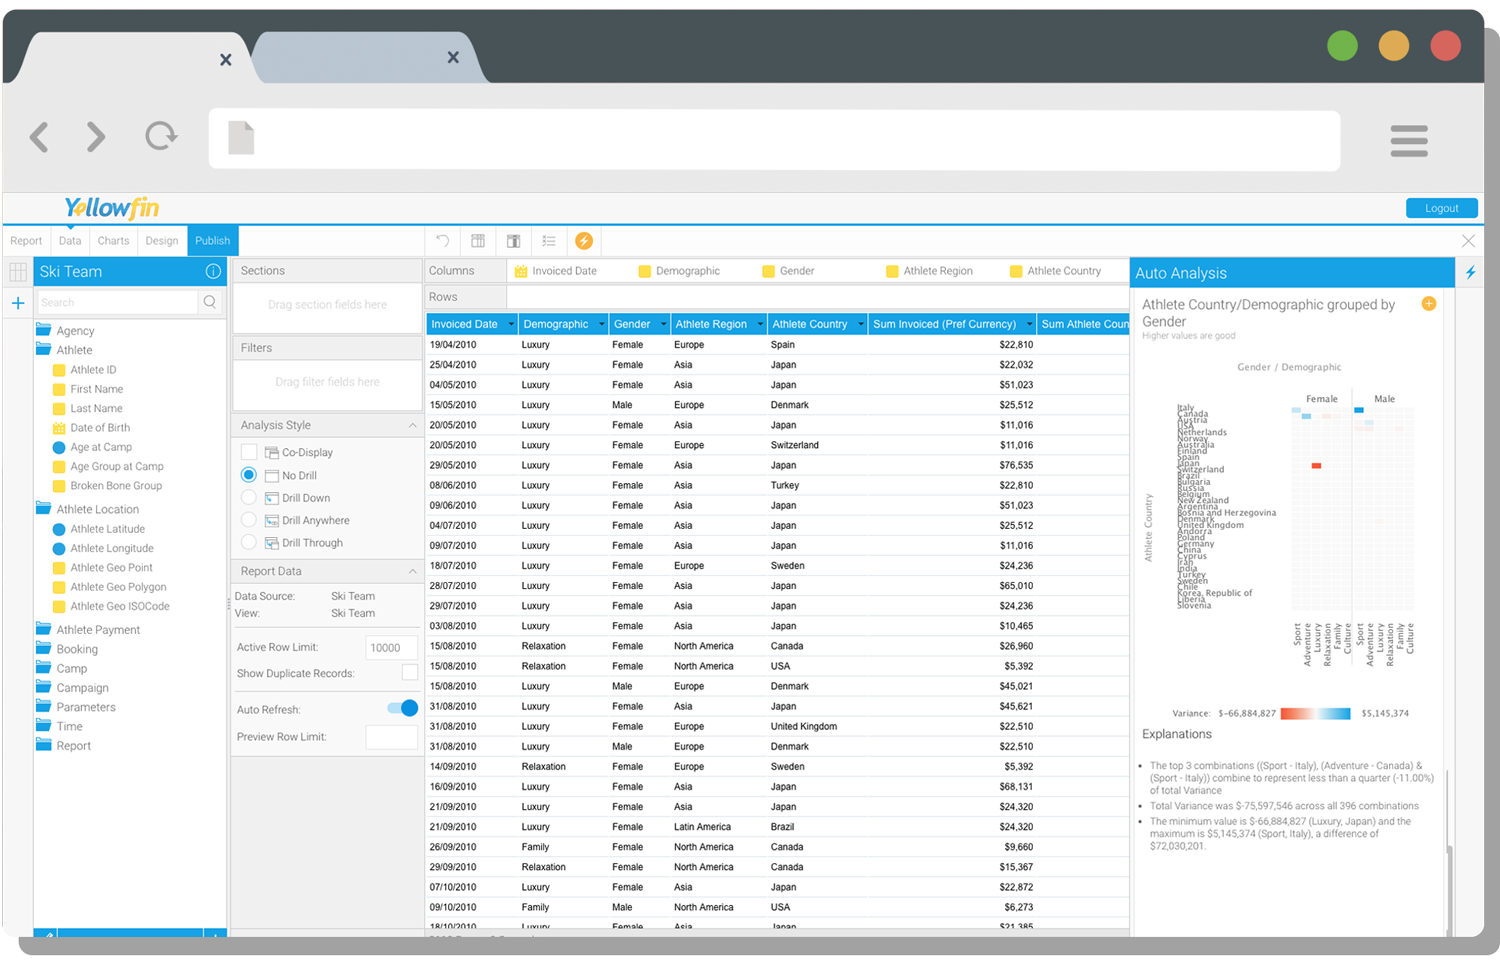
First, select the data you want to query.
Then, call on the Insight Wizard. Here, add the context. Select which elements of the report you want to query – the metrics, dimensions, or date etc. – which fields you want to analyse and whether a higher value is good or bad.
Then, watch the magic happen.
You’ll get automatically generated charts, complete with explanations of what’s happening in them, from Insight Wizard. It searches for correlations and patterns in the data to serve up the most relevant insights, with minimal effort from you.
Select the visualizations you want and your work is done. Incredible.
If you generate reports or want to, this will make it super simple and save you hours of work or days of waiting if you outsource to analysts. You get insights fast.
Unearth the Why with Instant Insights
If that wasn’t impressive enough (after all, that’ll save you huge amounts of work), you can go one step further and ask why something changed.
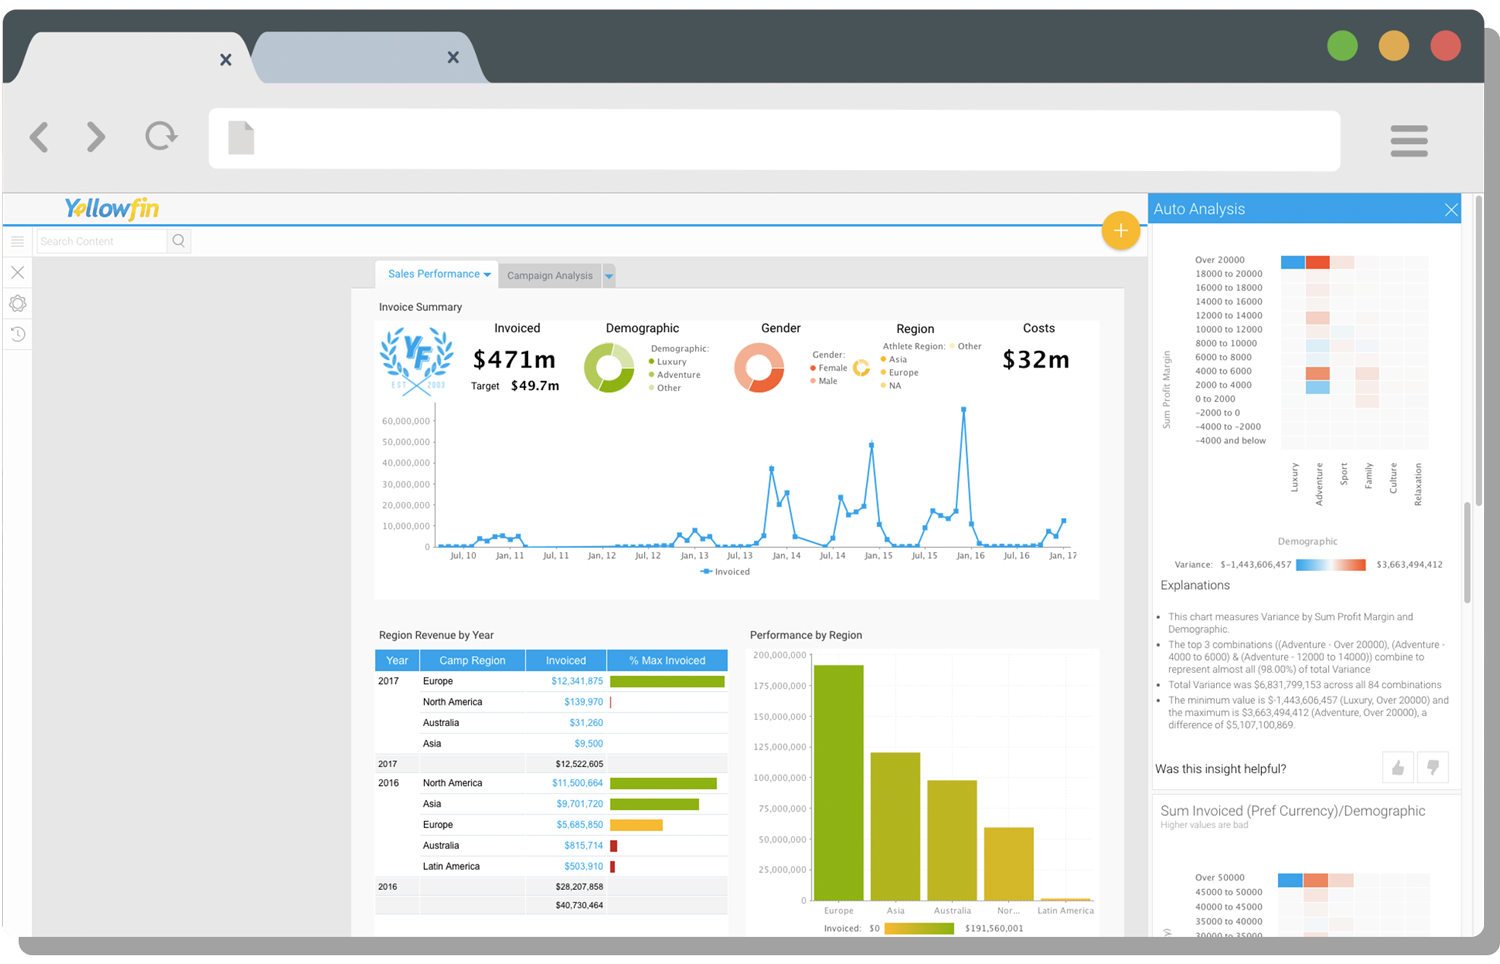
Just ask, “Why?” to Yellowfin using tooltip drop-down menu on any report.
It’ll do all the investigation for you. No more digging into reports. No more guessing what might have happened to cause the change. It’ll serve up the different factors that affected the change for you. All with a click.
Suddenly, you can see why – why your profits soared, why you had a bad sales month, why your North America region sold more of one product than other regions. You can then see how to replicate or avoid that change next time because you know what caused it.
Business users, you can get the insights instantly without any manual intervention. In most other tools, this process would take hours, even days.
![]()
Transform your data from the source
Data stewards, have you ever wanted to better prepare your data for analysis? You not only want to extract, but also clean, blend, enrich, and transform your data before loading it in the data warehouse.
What if you could do all of this in the same tool that you use to produce your reports and dashboards? With Yellowfin 7.4, you can do it all. You can clean, blend, enrich, and transform your data before it is reported on, all within Yellowfin. You can get to your insights faster because you can go from data source to dashboards in one platform.
All too often, you are required to buy multiple tools or modules, which adds to your cost and integration complexity. Yellowfin 7.4, allows you to do all this, at no extra cost, all integrated within the platform.
Productionize Data Science
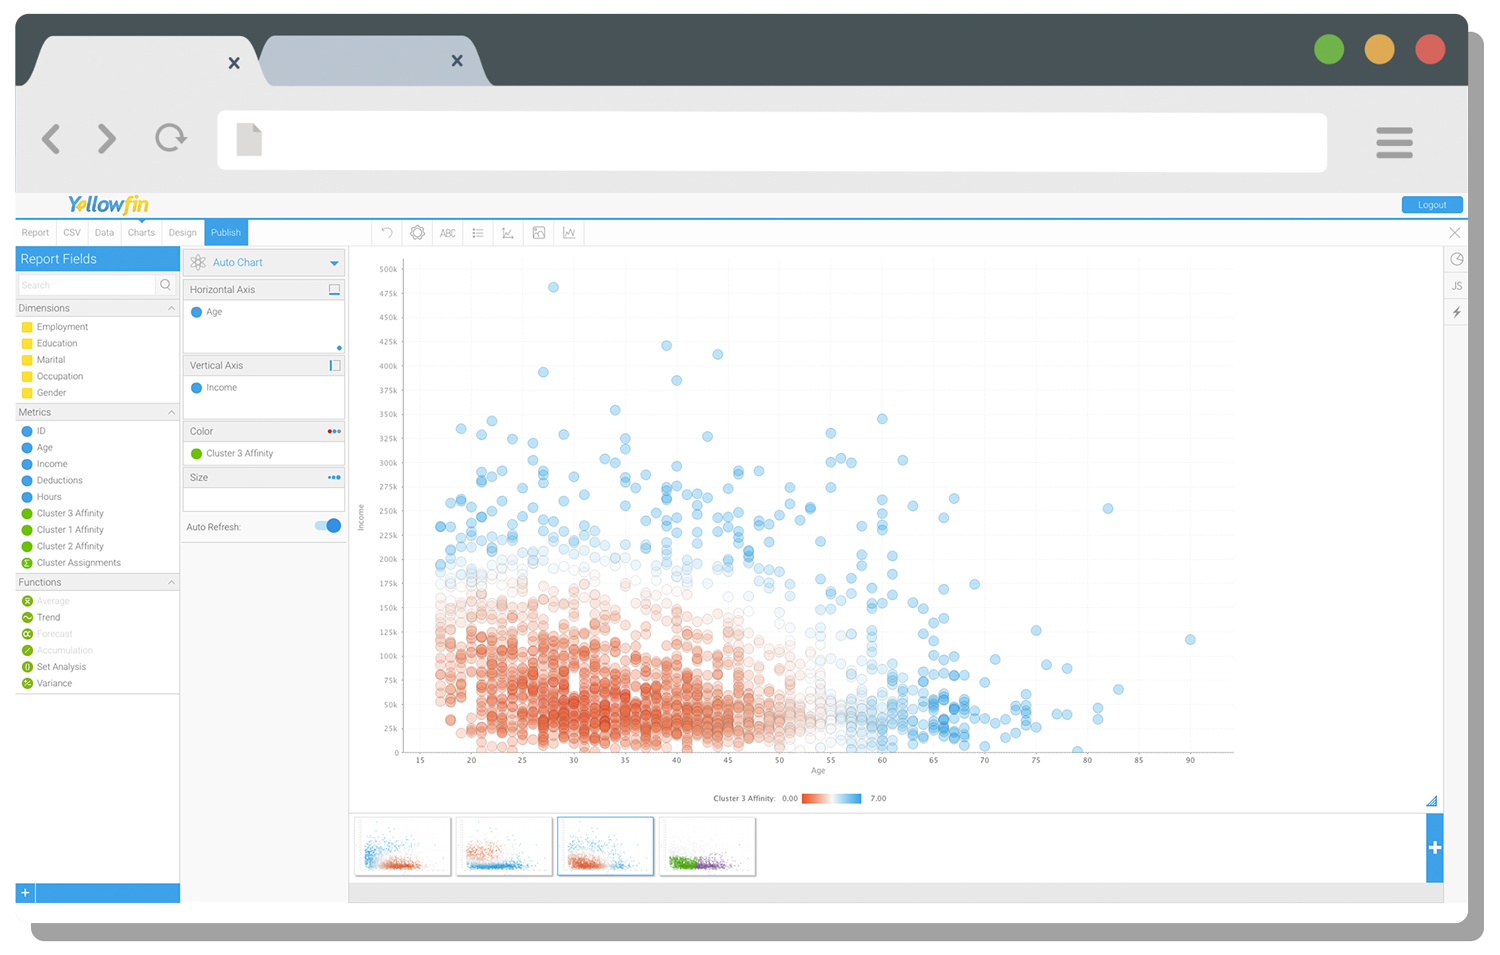
With Data Transformation in Yellowfin 7.4, you can extract data from its source (relational databases or APIs) and perform transformations that bring your statistical models into business use. You can perform transformations like running an R model against client data to predict churn, then store that data in a database format to report on.
No longer will your models be stuck in silos away from the business and in separate tools, which is the case with most leading BI tools. Now, with Yellowfin 7.4, you can productionize your models and create data sets that can be presented back to users as reports and dashboards. Models can come to life in your enterprise BI environment.
Develop analytical applications faster, use app integrations like R and Python, and even utilize PMML and PFA support. All your data refinement and transformation can be done inside Yellowfin 7.4. Go from data to dashboards in one platform.
Fewer tools mean less hassle and faster insights.
Find out more about Yellowfin 7.4 by registering for the launch webinar in October.
![]()