

FusionCharts Teams up with Yellowfin to Deliver More Embedded BI Options
We are excited to announce that FusionCharts and Yellowfin are teaming up to deliver more embedded business intelligence (BI) options to our customers.
When it comes to analytics, “one size does not fit all.” The combined capabilities of FusionCharts and Yellowfin is set to provide more options to product managers, CTOs, and developers to build flexible solutions with developer-friendly licensing options.
Embedded BI today provides many options to modernize and even reinvent web applications. Study after study demonstrates that with the right sponsorship and strategy, organizations can deliver incredible value to customers by making data more accessible and enabling better decisions. So where do you start with embedded BI?
Here are 4 approaches to adding analytics to your app with Yellowfin and FusionCharts.
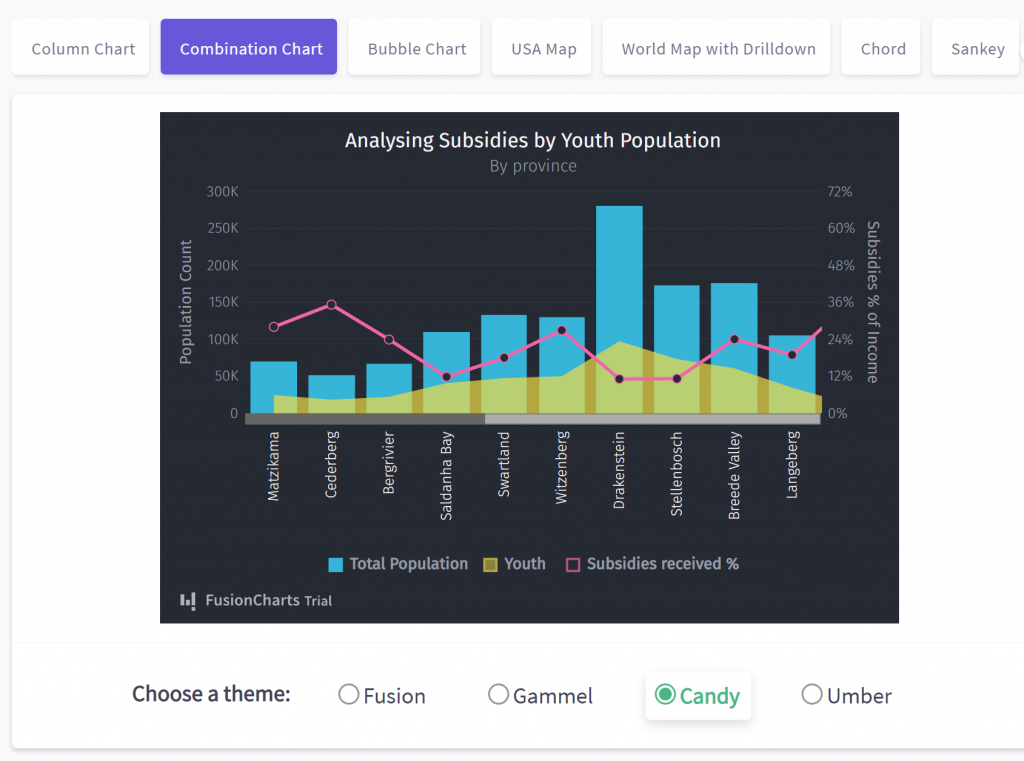
1. Beautiful Charts
Customer expectations have become increasingly sophisticated when it comes to UI. Yet many applications use outdated charting engines and widgets. It is surprising that large organizations often leave the choice of charting libraries to individual developers, or even their outsourcing partners. Functionality, look and feel, and even security get sacrificed in order to get minimal savings. By teaming up with FusionCharts, Yellowfin can provide some of the best graphics in the industry that are enterprise ready.
FusionCharts helps you build beautiful dashboards for your web & mobile projects. With extensive documentation, cross-browser support, and a consistent API, it is easier than ever to add interactive and responsive charts. From simple charts like line, column, and pie to domain-specific charts like heatmaps, radar, and stock charts we’ve got you covered. FusionCharts also offers a way to export and share data. FusionExport enables you to convert your live dashboards to PDF or images. It works with all JavaScript charting libraries (FusionCharts, HighCharts, d3, Chart.js or others) and is easy to install. It includes SDKs for Java, Node.js, C#, Go, and many more.
From mobile to web and complex reports to modern visualizations, we’ve got you covered with 100+ charts and 2000+ maps.
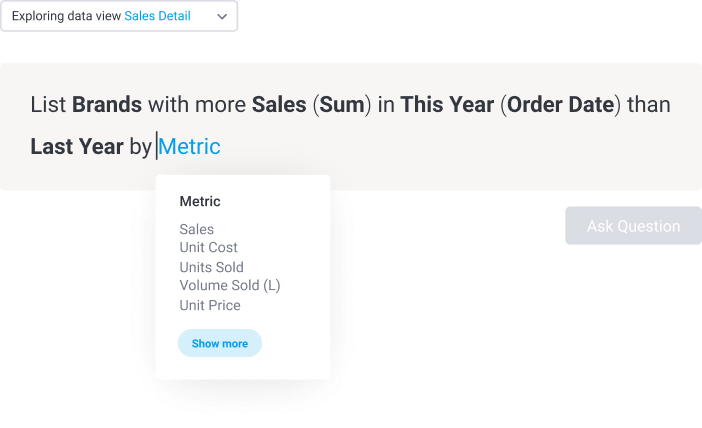
2. Self-Service Analytics
Embedded analytics has evolved significantly since its earliest inception. You no longer need a fully designed dashboard-ing experience to get started. Yellowfin has created self-service analytics functionality using Guided NLQ (Natural Language Query) that can make integration of BI into your product experience much easier. You still need to do the data wiring in the background, but the important customer UI journey can be gradual, and based on learning from how your customers engage with data.
3. Analytics and Reporting Module
Another way to embed analytics in your app is to take a modular approach. Instead of starting with integrated use cases, you can present a white-labeled version of Yellowfin as a stand-alone reporting module. You can keep your web application and your analytics application fairly independent.
As an interim step, you can even start with a more generic version of Yellowfin and then decide on the amount of integration and customization you want to achieve.
This approach gives you optionality and allows you to move relatively quickly. Depending on your level of Dev Ops sophistication, you can even run a Software as a Service (SaaS) version of Yellowfin that will save you implementation, although you will lose some control and flexibility.
4. Integrated Solution
Many customers prefer to go “all in.” That is a testament to the maturity of the industry and use cases. Many executives and teams know that they need to have embedded analytics in their applications. Building your own is way too difficult and expensive unless you are a massive company, and even then your resources are likely better spent elsewhere.
These approaches are not mutually exclusive. Embedded BI is a journey that you can start at different points and iterate as you learn. You can use FusionCharts with Yellowfin and a variety of scenarios, or use one or the other. The reality is that getting your data in order is probably one of the most complicated things regardless of where you start. Even there, we can help you to build a staged approach, so you and your organization do not get overwhelmed.
Let the journey begin, contact one of our experts or request a free demo to get started.
Yellowfin Analytics - Get a Demo
Try Yellowfin for yourself and see how our embedded analytics suite can transform the way your users access, analyze and collaborate with data.
About Yellowfin
Yellowfin is a global BI and analytics software vendor with a suite of world-class products powered by automation. Yellowfin is recognized as an innovator by the world’s leading analyst firms. More than 29,000 organizations and over 3 million end-users across 75 countries use Yellowfin every day.
Idera, Inc. PR:
FOLIO Communications
idera@foliocom.com
press@idera.com