
How to calculate Total Avg on the chart?
10 August, 2013
How to calculate Total Avg on the chart?
I have create Line Chart and show series selection type on top panel.
I checked average value display on chart .
The average value is display not equal the Avg total on table.
Can i write a function to calculate it on the chart ?
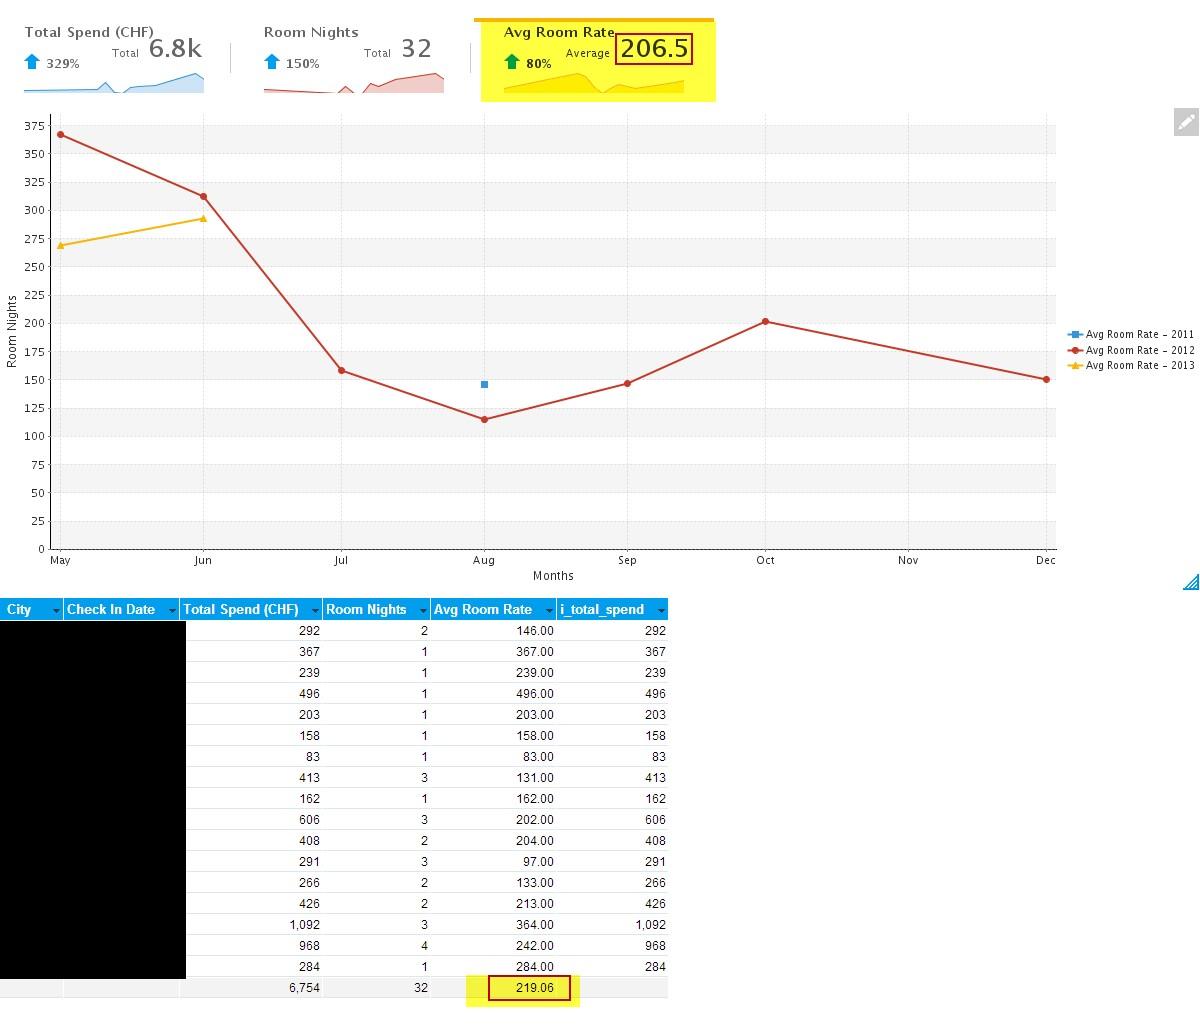
Sample : I want to show sum total spend/sum total room nights (6754/32=211.06) on top panel.
Please suggestion me how to calculate the average on chart ?.
Thank you in advance,
Ann
I have create Line Chart and show series selection type on top panel.
I checked average value display on chart .
The average value is display not equal the Avg total on table.
Can i write a function to calculate it on the chart ?
Sample : I want to show sum total spend/sum total room nights (6754/32=211.06) on top panel.
Please suggestion me how to calculate the average on chart ?.
Thank you in advance,
Ann
Hi Ann,
I have been trying to reproduce this error of the two averages not being the same and try as I might, I have not been able to:

Could you please tell us if the data shown in your screenshot is the full set of data? And also, are you able to reveal the Check In Date column that is currently censored, this would help us understand your report better. Are you using any filters?
To answer your question about writing a function, the answer is yes, you could write a Calculated Field, for more information about this please see this Wiki page on Calculated Fields.
However, that would obviously be just a workaround, and we would much rather work out what is going on in your report, so if you supply that date column that would be great.
Regards,
Dave
I have been trying to reproduce this error of the two averages not being the same and try as I might, I have not been able to:
Could you please tell us if the data shown in your screenshot is the full set of data? And also, are you able to reveal the Check In Date column that is currently censored, this would help us understand your report better. Are you using any filters?
To answer your question about writing a function, the answer is yes, you could write a Calculated Field, for more information about this please see this Wiki page on Calculated Fields.
However, that would obviously be just a workaround, and we would much rather work out what is going on in your report, so if you supply that date column that would be great.
Regards,
Dave
Hi David,
I have test created the sample report for to calculate Total Avg on the chart. But the two averages not same. Please see screenshot below :
Could you please tell me about the chart, how to calculate average on the chart and the data table on the report?
I have attached the script table and the xml flie for you. Could you please kindly advise me about this?
Thanks,
Ann
Hi Ann,
Unfortunately the attachments don't seem to be attached, but no matter because
I'm wondering whether the 2 different averages are caused by different decimal place formatting at different levels throughout the application.
Could you please check that the Avg Room Rate field has the same number of decimal places in the database as it has in the view and also in the report. For example, it might have 2 decimal places in the database (eg. 1.23) and in the Yellowfin view, but be rounded off at the report level (eg. 1.00) and this could account for the difference averages.
Regards,
Dave
Hi David,
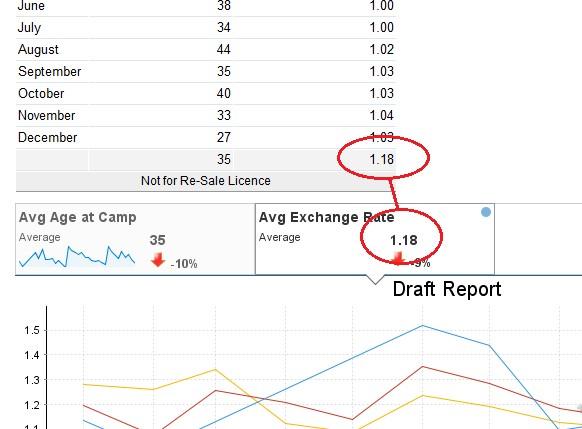
I have checked the number of decimal places again ,it is used 2 decimal places in the view and in the database. But on the report display the difference averages. I have attached the csv flie for you.
Please check this against again.
Thanks in advance.
Ann
I have checked the number of decimal places again ,it is used 2 decimal places in the view and in the database. But on the report display the difference averages. I have attached the csv flie for you.
Please check this against again.
Thanks in advance.
Ann
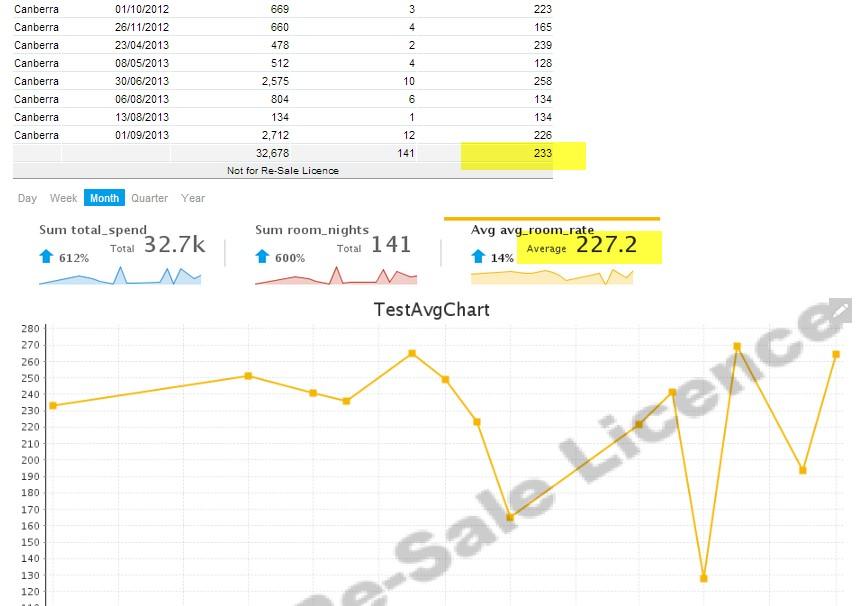
Any news on this? This is still a problem: if you make an calculated total on a column, then a chart will not display the calculated total, but the underlying aggregation (a average for example). Example is available above in the screenshot from Kanjanu
Correction: You can alter this in 'Chart', under 'Measure', hover over the measure, right on the arrow down 'Column Total' instead of 'Default aggregate total'.
Solved my issue!
Solved my issue!
Ad: this is only possible in Numeric Display. Not on every chart. Would be a important update in YF!
Ad: this is only possible in Numeric Display. Not on every chart. Would be a important update in YF!