-
On-Demand Webinar: Securing and Governing Your Analytics Data with Yellowfin. Watch now
-
Yellowfin Named a Visionary for Third Consecutive Year in 2022 Gartner Magic Quadrant for Analytics & BI Platforms. Read more
-
2022 Gartner Market Guide for Augmented Analytics Read more
-
Check out what’s new in Yellowfin 9.8
-
Yellowfin Interactive Dashboard Gallery – See the world’s most beautiful dashboards in action. Explore
Dashboard Gallery
Explore our interactive dashboard and design gallery
- Analytics Best practice
- Dashboard Gallery
- Element Care
For the full experience, please use a desktop browser to view this page.
Element Care
This Element Care Dashboard is an example of embedding or white labeling analytics into an existing application to deliver contextual data to the user within application workflows. In this case, data helps guide users through logging and managing incidents within hospitals.
Customer Example
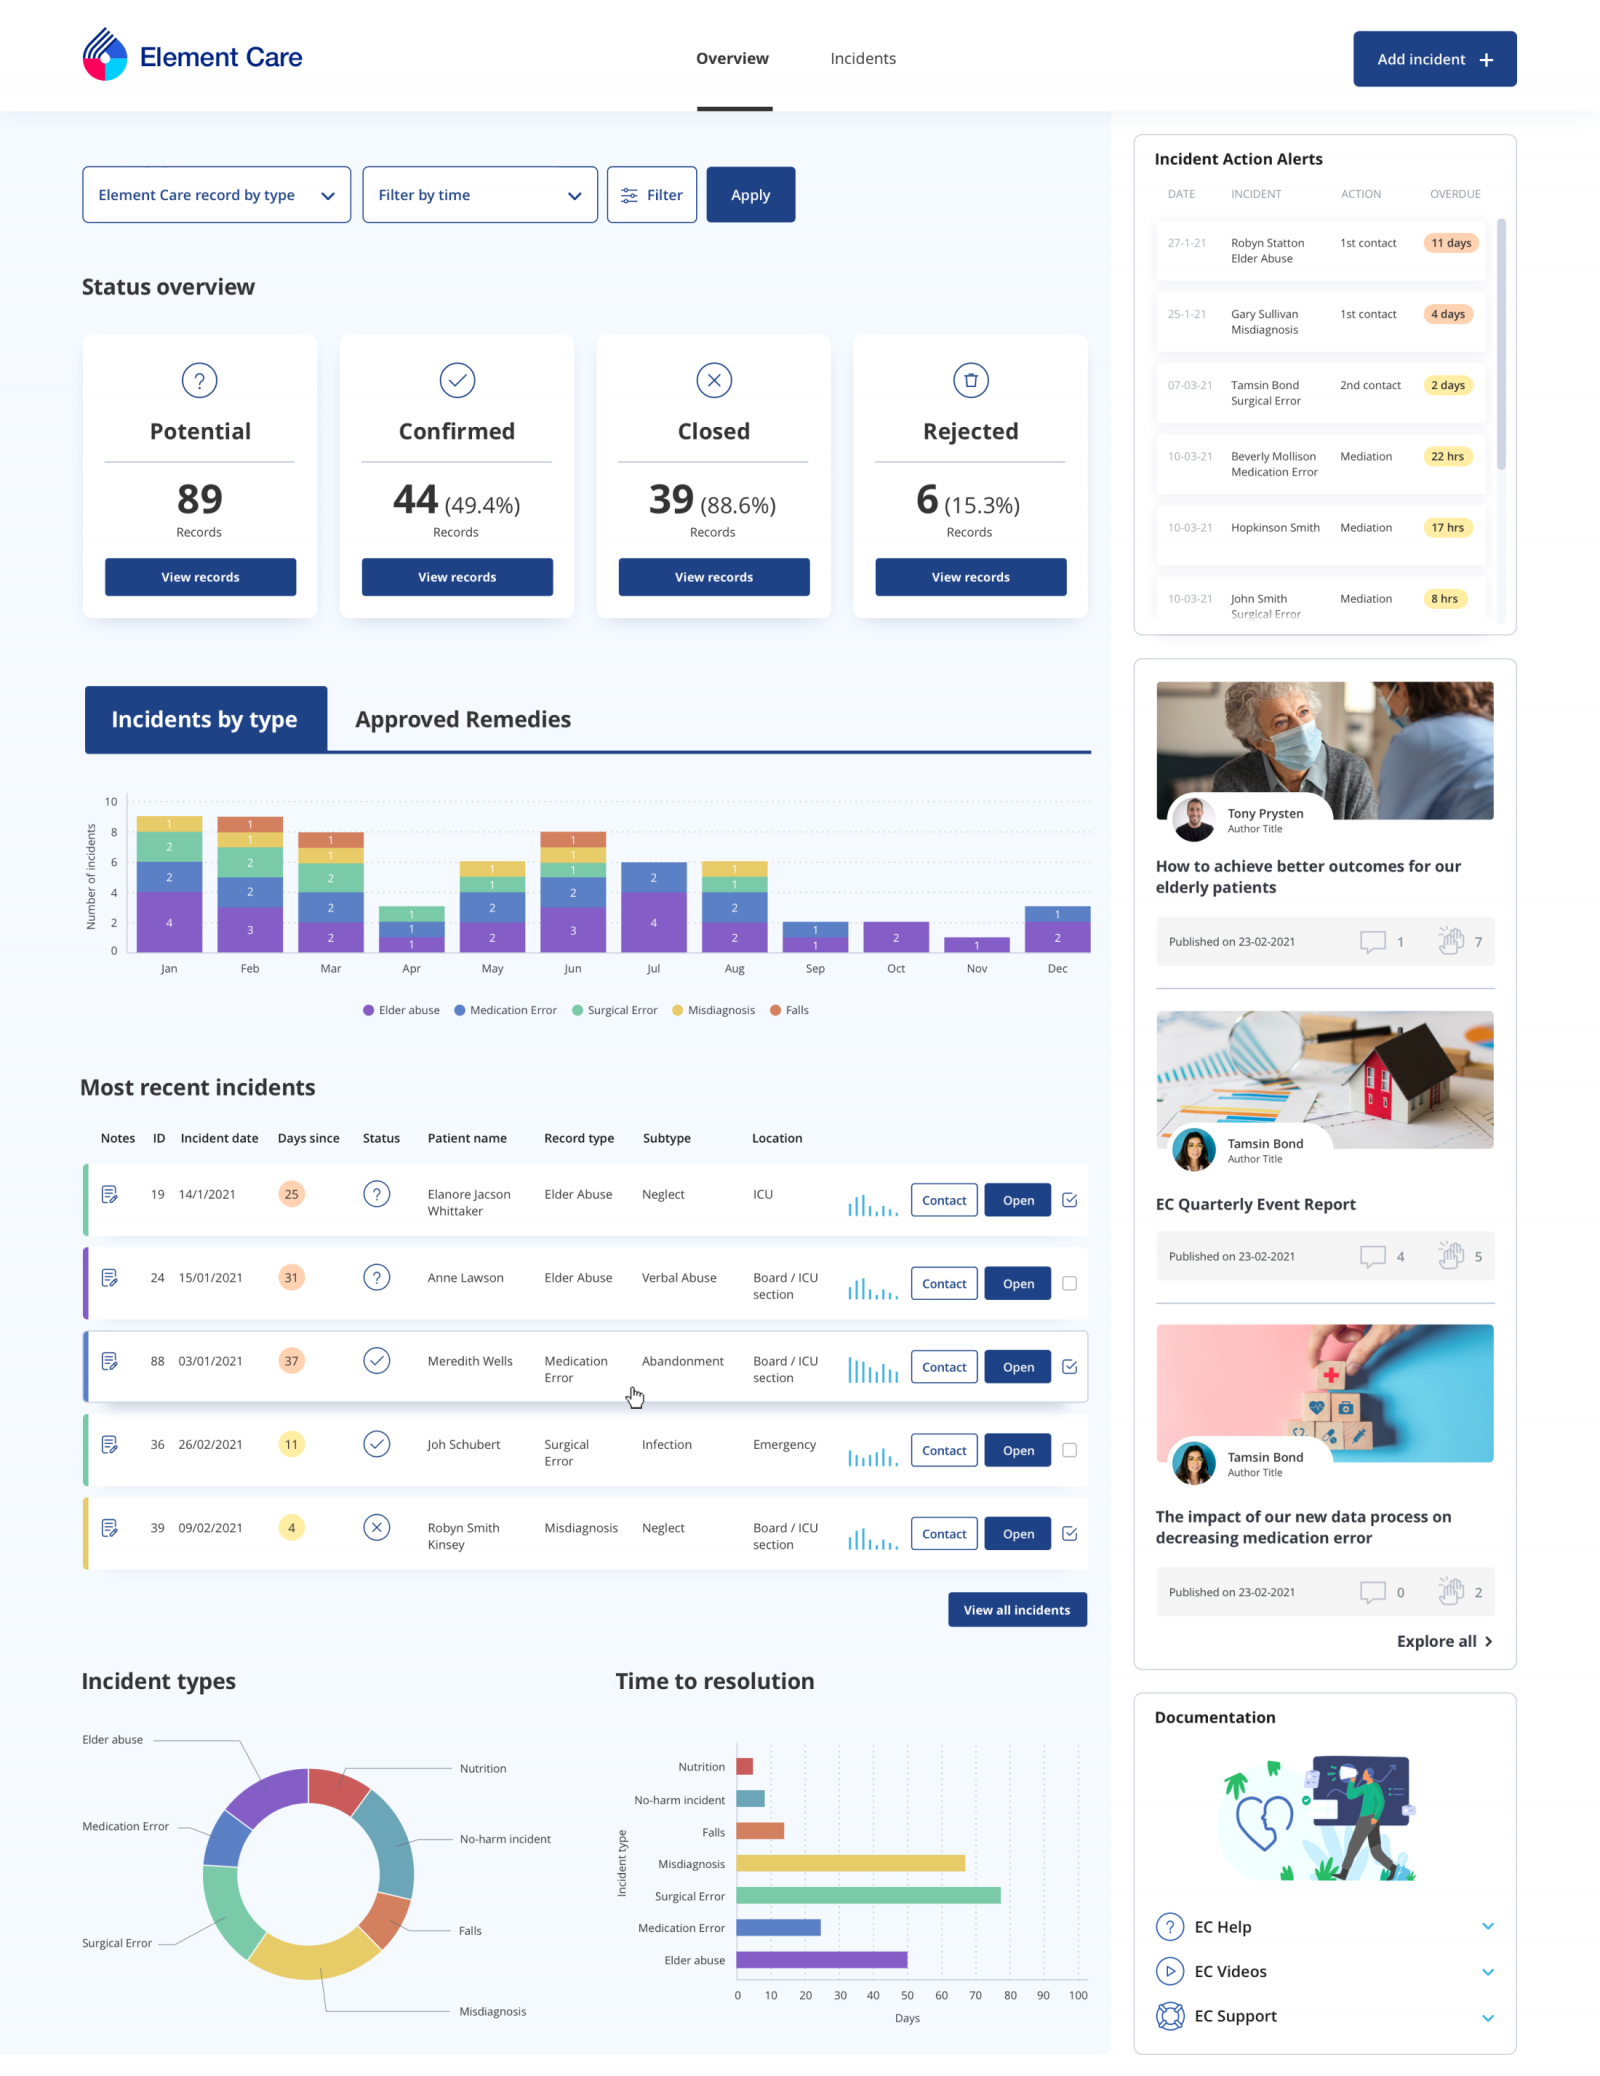
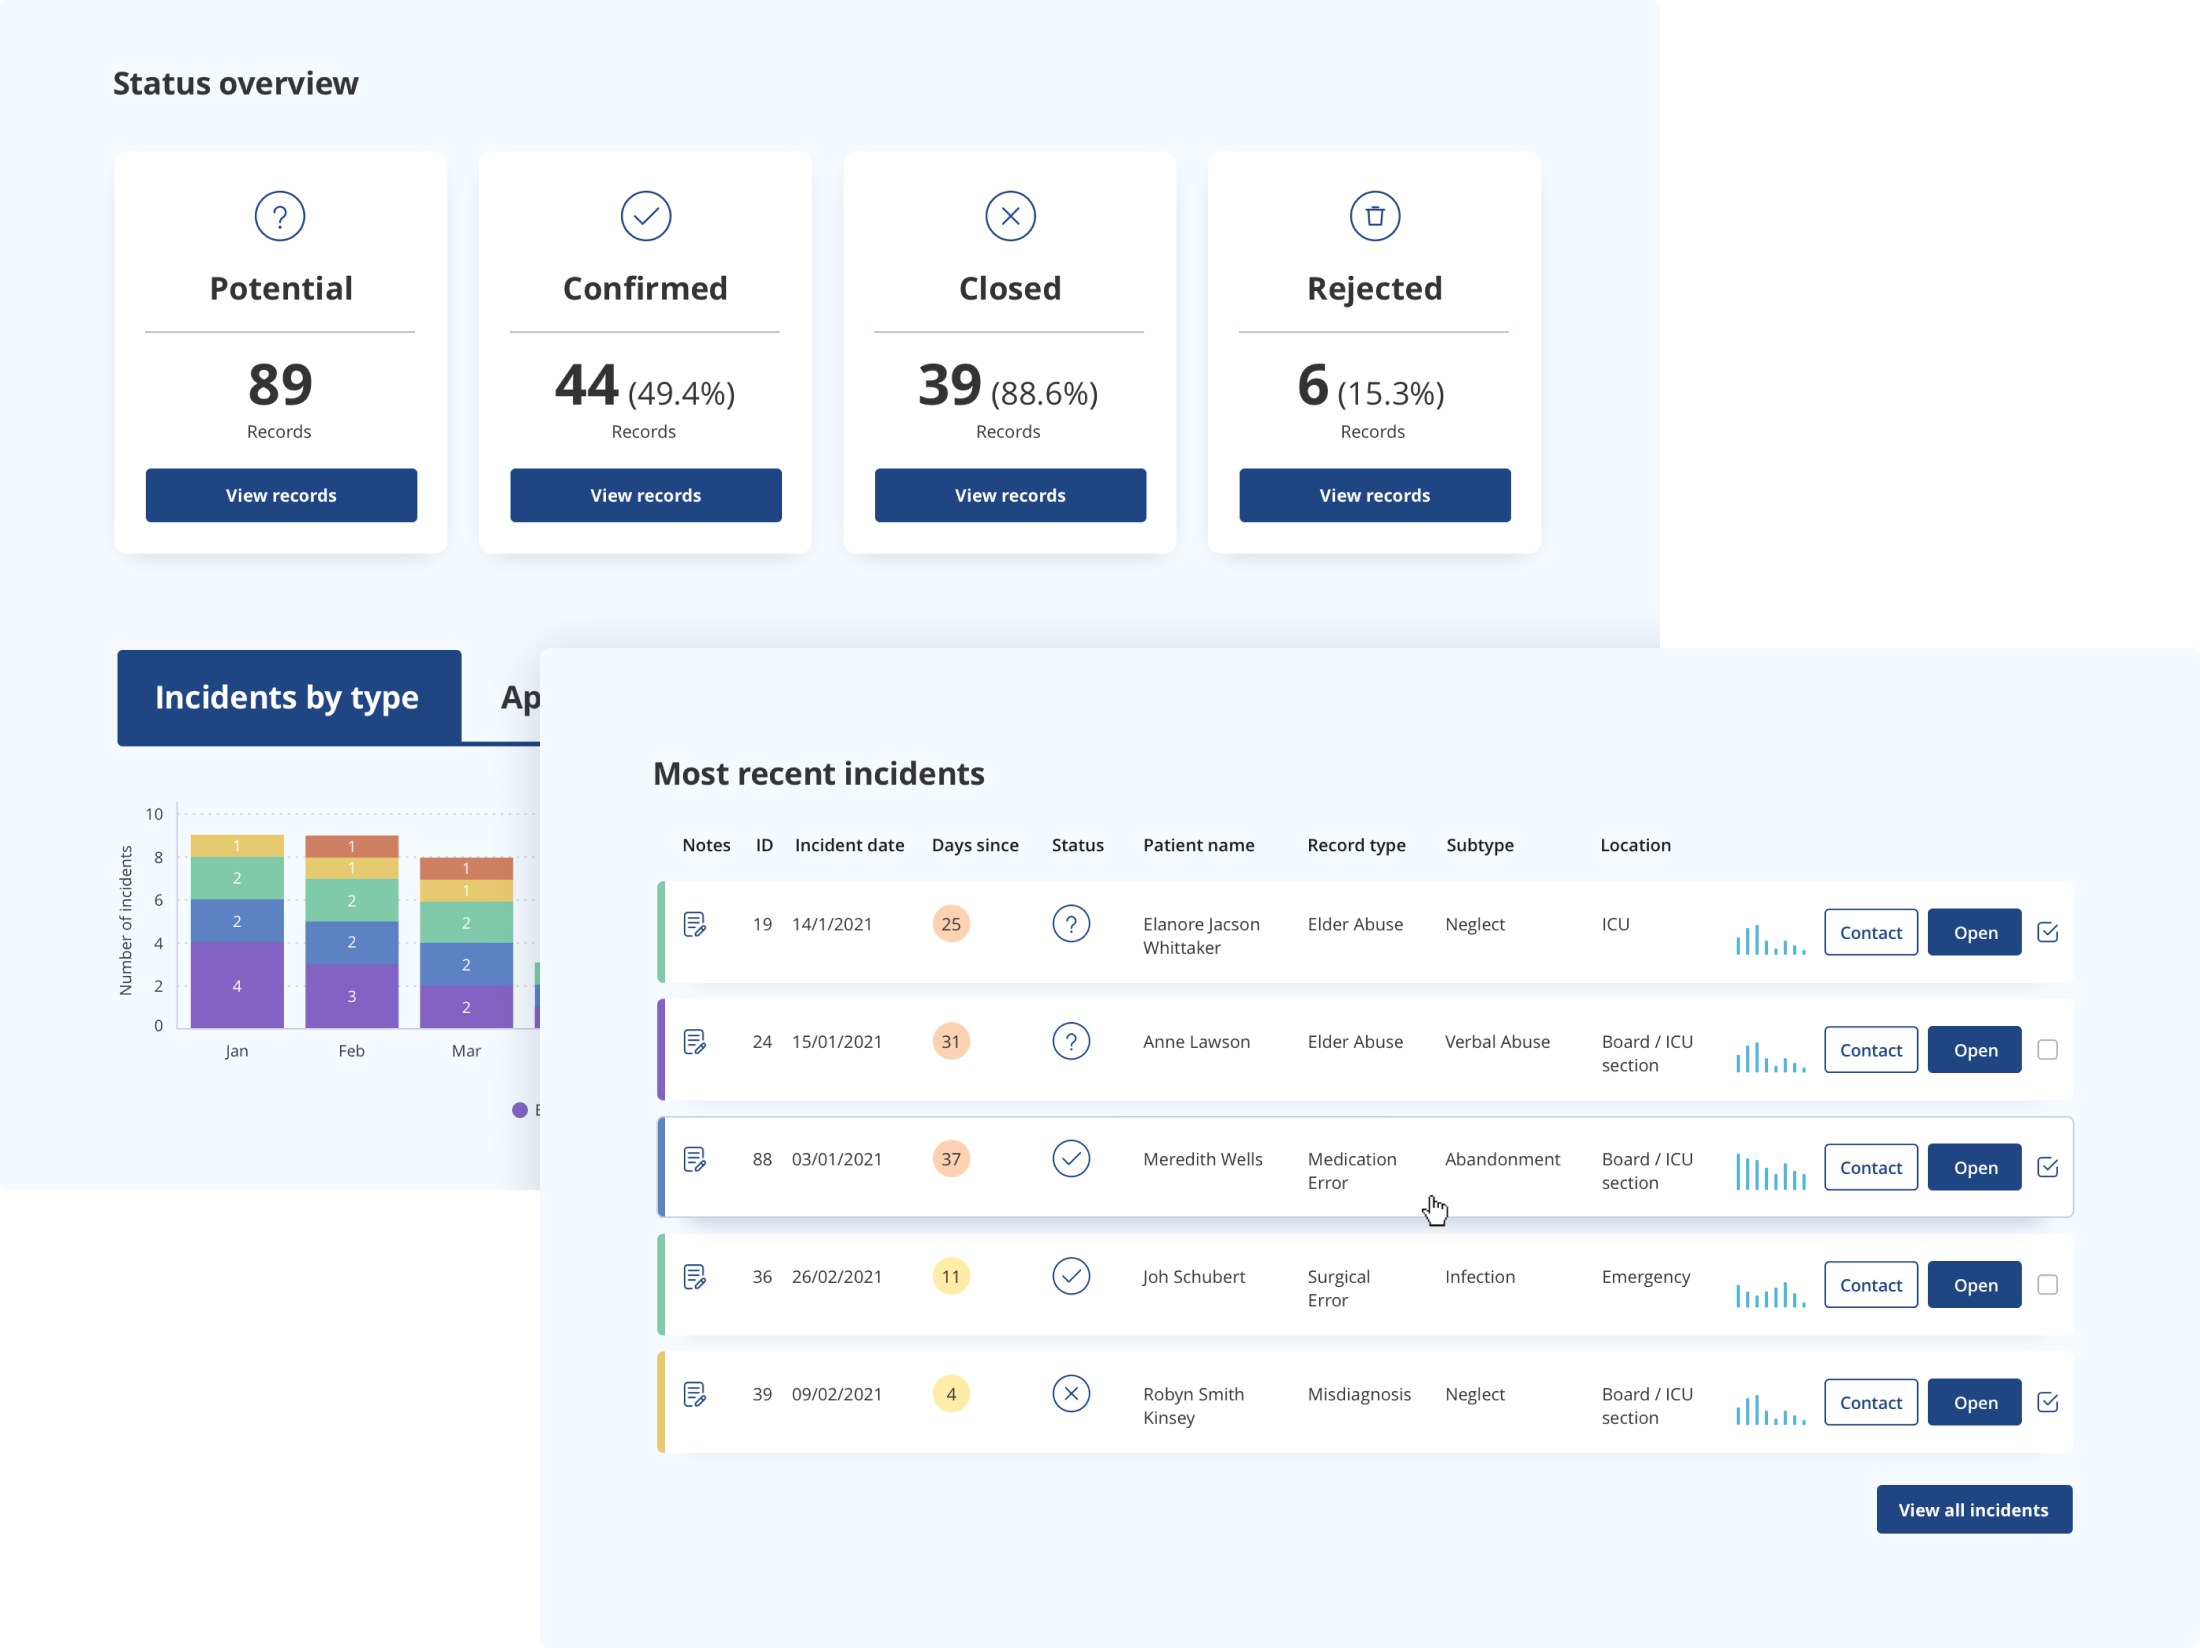
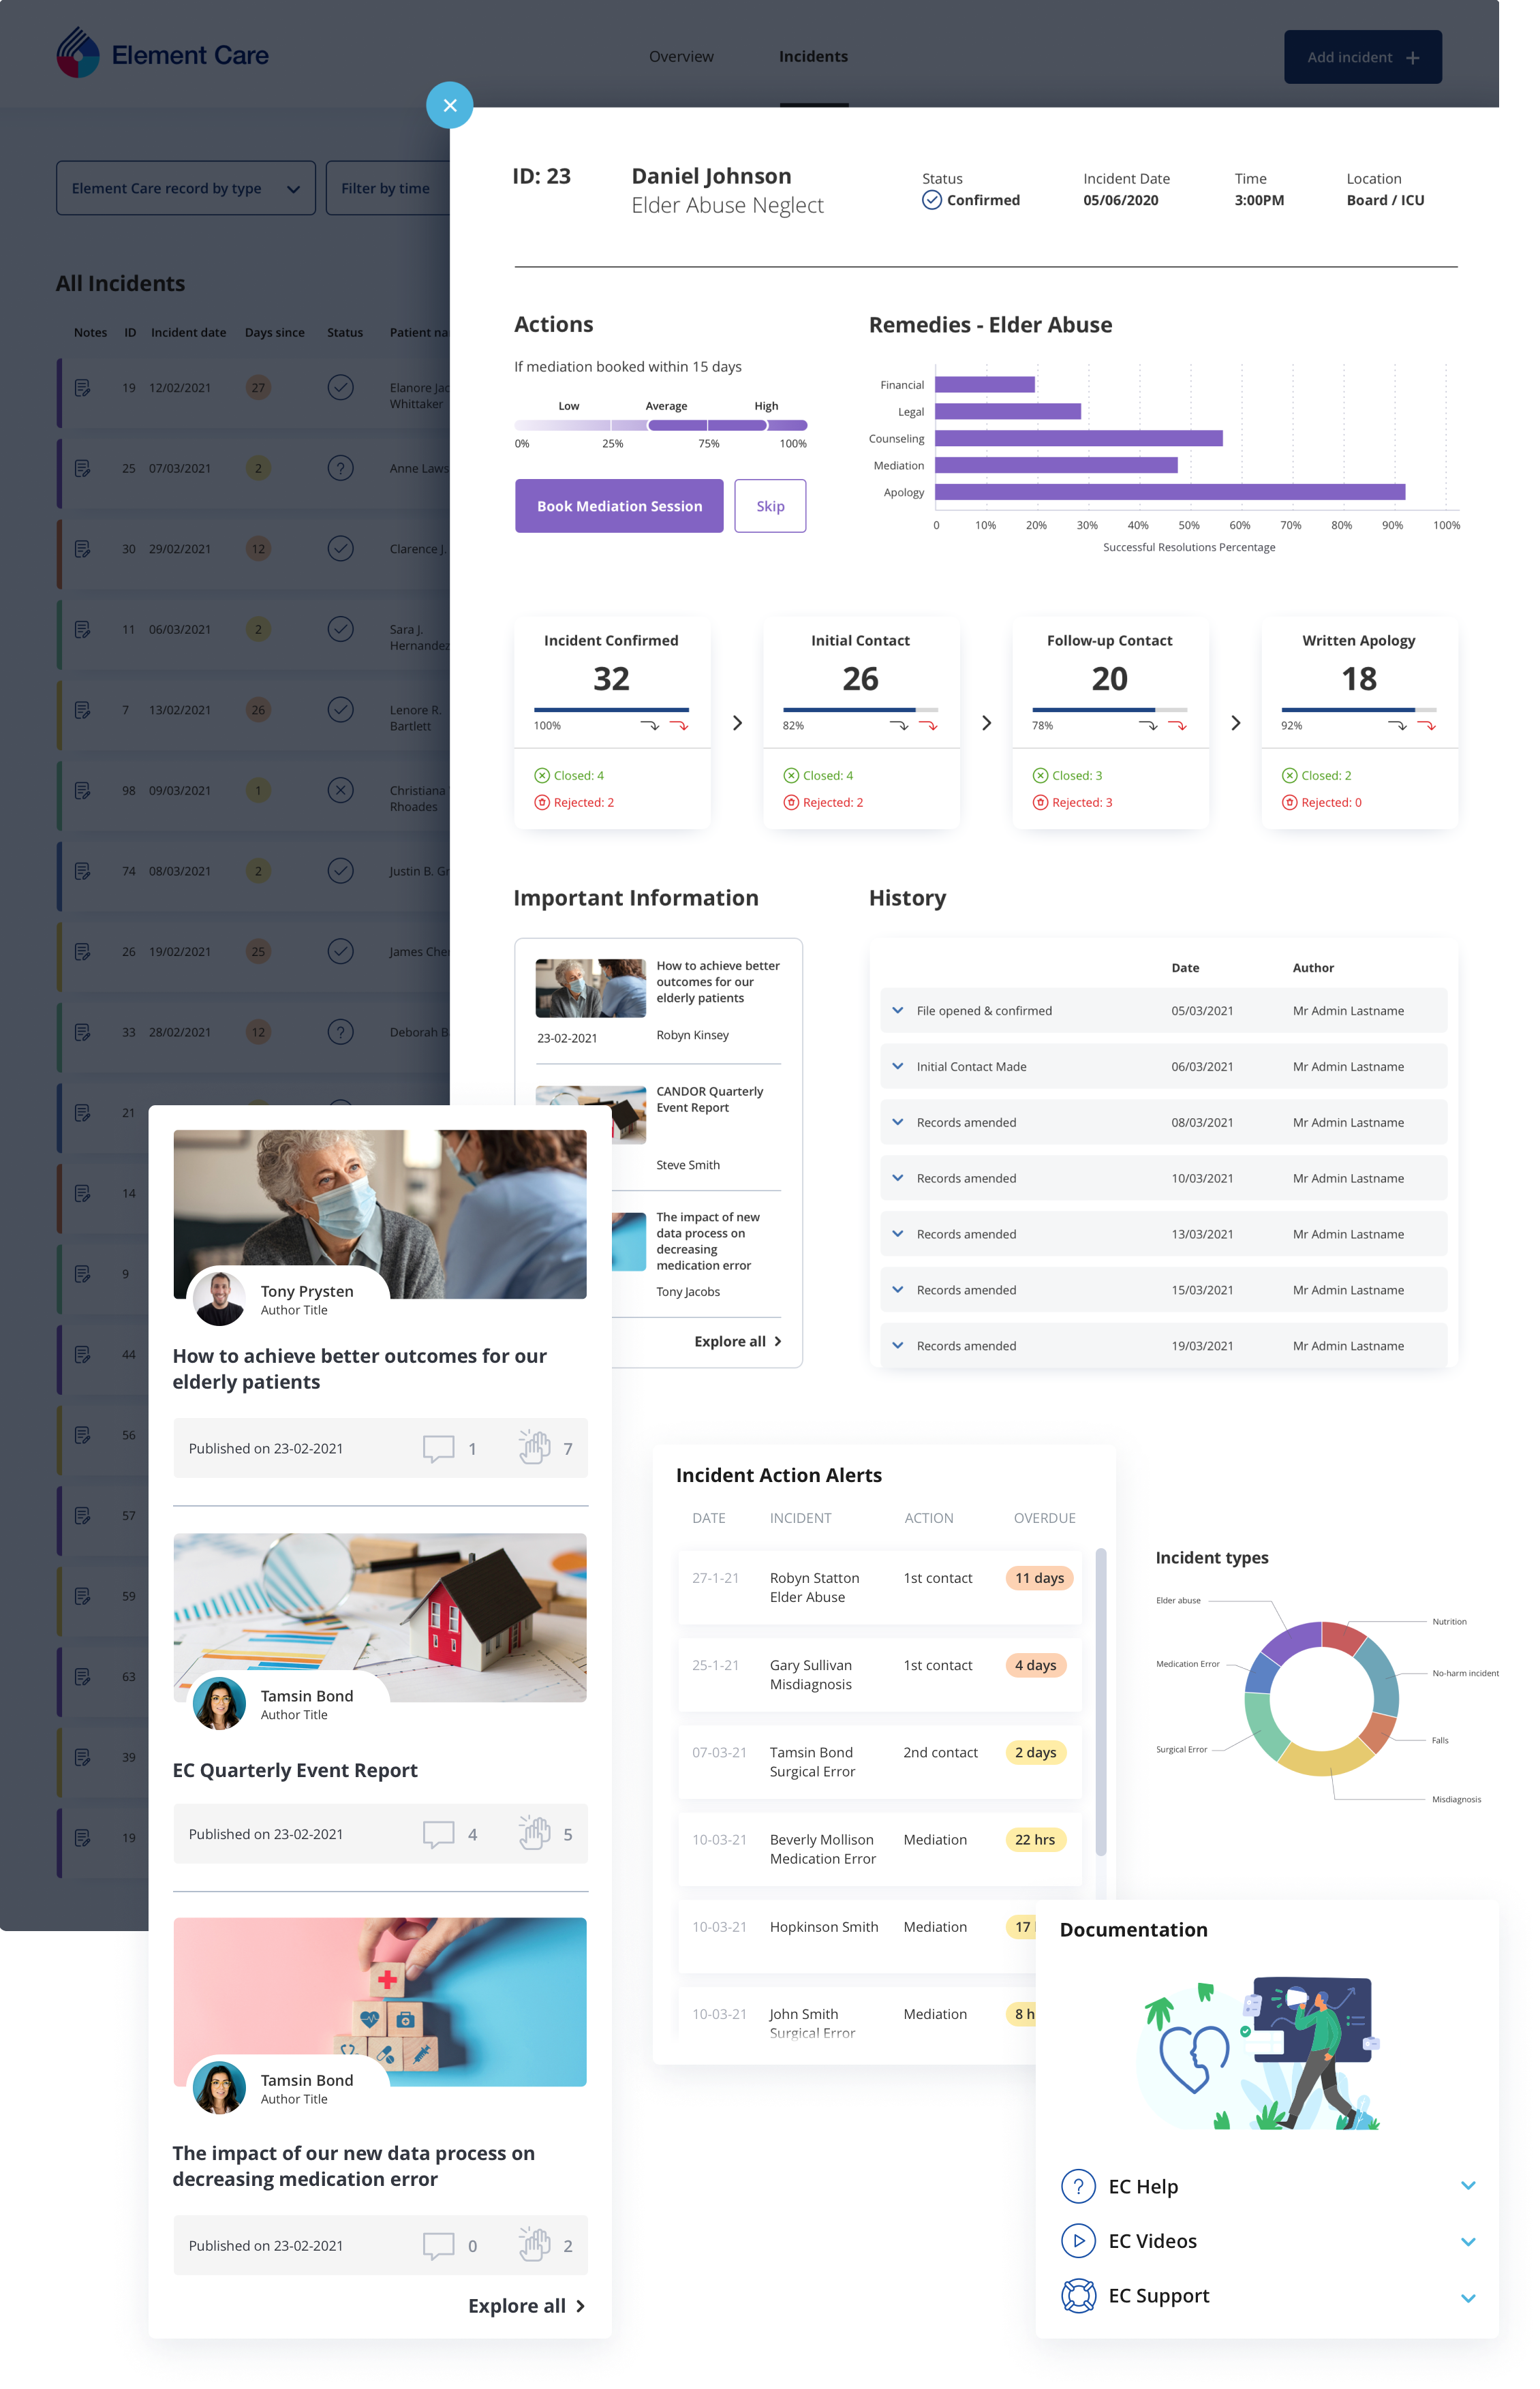
Interesting features include tables with sparklines, javascript slide-out panels containing charts and heat maps and an incident funnel visualization that tracks incidents as they progress through to completion.
This is a great example of an augmented analytics experience highlighting the ability to embed Yellowfin anywhere data can be used to guide end-user decision-making. This is also supported with automated monitoring and data storytelling features. All accessed, styled and embedded using the Yellowfin API.