
How to get the most out of Yellowfin’s Location Intelligence capabilities with drill down
With Yellowfin it’s so easy to drill down on my data, both on table and chart level. So, how can you use Drill Down functionality when it comes to maps and GIS data? How can you exploit the full power of Yellowfin’s Location Intelligence capabilities? Let’s use a scenario to demonstrate. You’re an investor, and would like to identify opportunities for selling and buying properties.
With Yellowfin, you can easily overlay your GIS data on a Google Map, defining different regions with the use of polygons. You can then drill down into each polygon to analyze the data at a greater level of granularity – from states, to counties, to suburbs.
Firstly, you need to ensure that you have all area shapes (polygons) that you require for reporting stored within your database. Polygons can be thought of as a collection of coordinates (latitude and longitude). For more information on shapes and polygons, please refer to the following Well-known text Wikipedia page.
Next, you have to enable Drill Down functionality in Yellowfin. To enable drill down, you have to define a hierarchy. For more information on how to set-up your hierarchy, please read our Drill Down Hierarchies Wiki post.
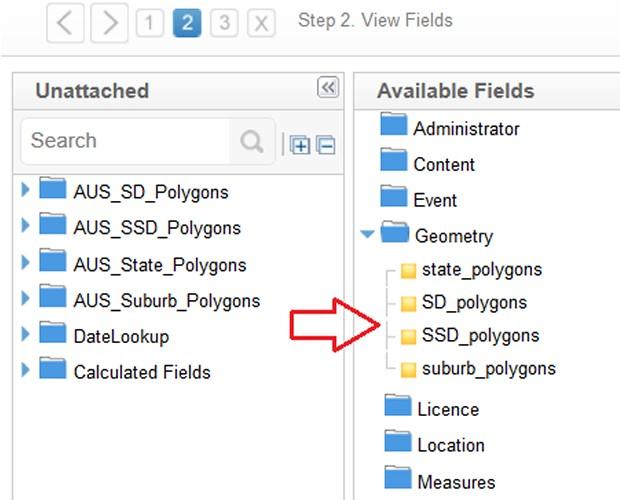
Now, if you – as a property investor – want to drill down the following path (State -> Statistical Division (SD) -> Statistical Sub Division (SSD) -> Suburb), a hierarchy between polygons for the above areas should be defined.
Simply put each member of your hierarchy in edit mode, select the Data Conversion Tab, and select WKT Geometry Converter from a drop down list of available options.

As soon as you specify the converter, an additional ‘Cache Field’ option will appear. From there, select the area name from your drop down list, which is relevant to your polygons.
For example, if you’re applying your WKT converter on State_polygons, you have to choose ‘State’ as a dimension on which your polygons can be cached.

Repeat this ‘Data Conversion’ set-up for each member of your hierarchy. Then, save your view.
Now you can start creating your report. With Yellowfin’s user-friendly drag and drop report builder, you’re only minutes away from seeing your data in action!
Drag and drop your State_polygons dimension, and a few metrics you want to visualize, to your report builder area. Then, activate Drill Down functionality. Make sure that you choose ‘Chart only’ or ‘Table and Chart’ as an output for your report:

From there, run your report. Click on the ‘Chart’ tab and select the Google Map with Polygons option:

Proceed to ‘settings’ under chart menu, and activate the Series Selection option. Doing so gives you the ability to switch between different metrics, and analyze how each defined mapping area is performing based on each selected metric. It’s that easy!

Now, simply run your report again. To analyze the geographic spread of houses for sale in New South Wales, just click to drill down and view data distribution across each SD within the state of New South Wales. By clicking on one of those SDs, you’re then able to view the SSDs within each SD, and the distribution of houses for sales across each suburb area.


Now you’re ready to make those property investments with confidence!