

Yellowfin Signals: Discovering Critical Changes in Google Analytics data
In October 2018, we launched two new products into the Yellowfin Suite: Signals, an automated discovery product that discovers critical changes in your data as they happen, and Stories, a data storytelling product which enables users to provide better context to the numbers and create a common, consistent understanding across the organization.
What did we do next? Drink our own champagne, of course.
We rolled out Signals across all data sources that feed the Yellowfin ecosystem, and the first cab off the rank was Google Analytics (GA).
We already had pre-built dashboards on GA, but this isn’t about asking the usual questions around website data like, “How are my pageviews travelling this week?” “Are they new or returning visitors?” “From which sources and mediums?”...stuff that you would casually monitor on a dashboard if you bothered to look.
It’s about discovering critical and meaningful changes in our traffic - both good and bad - as they happen. Then we can act on it quickly if we need to or keep repeating things that are successful. In the scenario below, it includes identifying hidden outliers in pageviews that we need to know about before they become issues, and optimizing marketing accordingly.
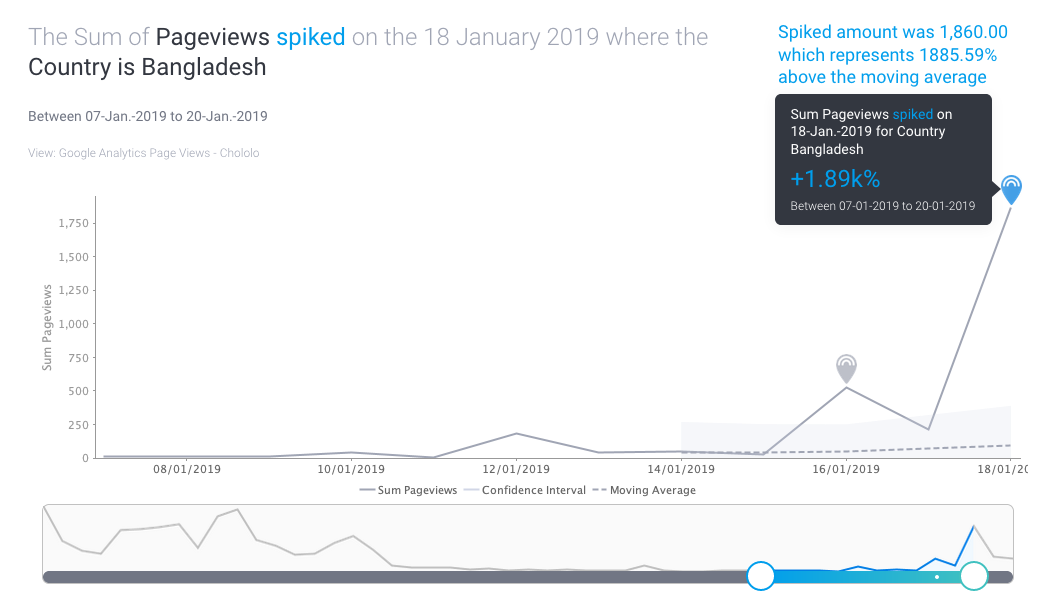
A working example: Website Traffic from Bangladesh
When we hooked up Signals to GA data in Yellowfin, we received some unexpected Signals: spikes in pageviews from Bangladesh on the 16th and 18th of January. Big spikes. We’re talking over +1800% in pageviews.
The automated analysis, supplemented by Assisted Insights immediately highlighted three key contributors to the spike that were statistically-significant: paid ads (Medium), on a specific campaign (Landing Page Title), from mobile devices (Device Category).


Assisted Insights further summarized the three key contributors into one heat grid with accompanying narratives:

This was very odd as we had a list of targeted countries for ads, and Bangladesh wasn’t one of them, much less for that specific campaign. So what was driving this?
Could it have been a click farm (i.e. where someone targets ads either manually or via bots to run up clicks and ad spend, stopping ads from running for real people)? Or did our ads actually run in Bangladesh?
If our ad/campaign data had been hooked up for Signals, we would have seen that relationship but it wasn’t set up at that time (doh!). So, we did it the old way and made a phone call to our ad agency: it turns out that our ads were running in Bangladesh!
The agency made a mistake and did not limit ads to the locations we had chosen.
“When Scott set up the campaigns for some reason the default targeting location settings kicked in instead of the ‘in my location’ one. Thank you for flagging this, it has now been fixed. Apologies for that.”
- Our Agency
So every signal does indeed tell a story!
Surely Google Analytics Intelligence / Dashboard would have caught that?
We went back to the Google Analytics portal and had a look. Analytics Intelligence certainly didn’t discover this change, much less alert us about it:

What about the GA Dashboard? Well, every marketer will recognize the screenshot below: it’s what you go to when you want to look at metrics such as pageviews:

You couldn’t possibly spot the spike in traffic from Bangladesh here.
What you see here is high level, aggregated away, and unfortunately the devil is in the details. We could have manually created exact segments for Country=Bangladesh, Device=Mobile, and Landing Page=Nucleus Research campaign, and then explored them. But, in the first place, why would we? And secondly, how could anyone explore every single possible segment or scenario on the dashboard and try to catch them every day? They couldn’t; finding any insight would have been accidental.
"It’s not possible for users to explore every possible combination and pattern using current approaches, let alone determine whether their findings are the most relevant, significant and actionable.”
Rita Sallam, "Augmented Analytics: The Future of Data and Analytics"
Yellowfin Signals provide predictable and purposeful discovery
In reality, we probably wouldn't have discovered this until we got the digital ad bill.
Lucky for us (and for you), Signals doesn’t care about the size of all possible combinations. It certainly doesn’t get tired of exploring all these slices of data. It’s not biased. It analyzes everything you throw at it and alerts you when something unusual happens in any slice as it happens. That’s the magic!
Read the second part of this series: Part 2 >
Discover Yellowfin Signals - automated data discovery designed to get you to insights in an instant.