

Hidden Costs and Insights in Embedded Analytics Pricing
Key takeaways of embedded BI pricing: TL;DR
- Hidden costs matter: Support, training, and infrastructure can significantly increase the total cost of ownership (TCO) expenses.
- Scalability impacts pricing: Costs may rise as user numbers or data usage grow, so plan ahead.
- Choose the right model: Align the pricing structures of embedded BI solutions with your business needs to avoid unexpected charges.
- Compare vendors carefully: Different embedded analytics providers offer varying features, flexibility, and pricing transparency, so a thorough evaluation is essential.
Interested in pricing for Yellowfin? Request a quote.
We’ve all been there: you’ve found the perfect solution for your product, but then you get to the pricing page and see a cost or pricing model that makes your jaw drop.
That’s the "sticker shock" we want to help you avoid when buying embedded analytics.
While the value of embedding BI is clear, not all pricing models are created equal. Some BI vendors hide costs that can quickly balloon your budget. In this article, we’ll shine a light on these hidden costs and compare different embedded analytics pricing approaches of the most popular embedded analytics solutions.
By understanding what to look out for, you can make a smarter decision that aligns with your business goals and avoids unexpected bills. Let’s dive in.
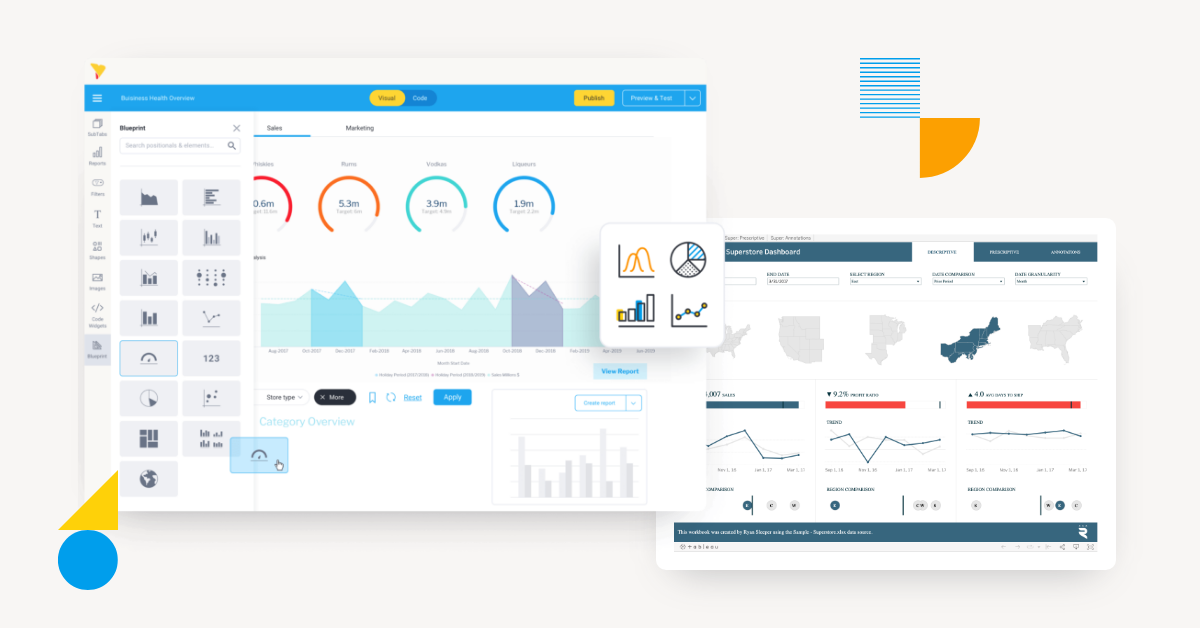
What is Yellowfin BI's pricing model?
Yellowfin pricing is designed for predictability and scalability, making it ideal for independent software vendors (ISVs) and original equipment manufacturers (OEMs) searching for an extensible analytics solution that can white-label analytics into their product. It is specially designed to align with your unique go-to-market model, to ensure predictability and scalability without hidden costs or surprises.
Rather than surprise costs or complex usage-based fees, Yellowfin approaches pricing for its embedded analytics platform with the mantra of “simple, predictable, and scalable”, dividing its pricing packages between two plans.
1. Embedded analytics (for software vendors)
This pricing plan is designed specifically for software vendors and is broken down into three straightforward models:
- Aligned utility model: This model aligns with how you sell your product. Yellowfin adjusts its pricing to match your specific needs, whether you charge per site, per app, or per device. This ensures your analytics costs scale predictably with your business.
- Revenue share model: Ideal for vendors who sell analytics as an add-on or premium module, this model is based on a percentage of the revenue you generate from those specific analytics modules. It's a risk-averse approach that ties your costs directly to your success.
- Server core: This provides a fixed price based on your server deployment (e.g., a 4-core deployment). It's a simple, fixed-cost solution that scales only as your infrastructure needs grow. This model gives you control and predictability over your analytics costs.
Yellowfin has several customers who have adopted different pricing plans to suit their business needs. For example, an electronic health records system (EHR) software vendor that specializes in supporting large-scale enterprises has found the revenue share model to be best suited for their business model, which sees Yellowfin make a percentage of each sale for every deployment to their service provider customers.
2. Enterprise BI
Enterprise BI pricing is best suited for large-scale deployments and larger organizations with more extensive data needs. This pricing plan is also categorized into 3 simple models:
- Named user: This model is best if you need to track a specific number of users. Pricing is based on how many individual users have access.
- Server: For larger-scale deployments that require significant processing power, this model is based on the number of CPU cores you need. This is ideal for ensuring performance as your user base and data grow.
- User tier: This model offers a more granular approach, allowing you to pay based on user roles—like "writers" who create, analyze, and share data, versus "consumers" who primarily interact with existing dashboards. This gives you the flexibility to align costs with how your different teams use the product.
In addition, Yellowfin provides options for extending, hosting, and database selection.
- Analytics plus: This plan includes advanced features, such as automated business monitoring with Yellowfin Signals, available on a named user, server, or custom basis.
- Self managed or fully managed service: You can choose to deploy and manage the solution yourself (on-premise or in the cloud) or have Yellowfin securely host it for you.
- Analytical database: For high-performance needs, you can leverage an in-memory analytics database on-premise or in the cloud, without being locked into a specific vendor or architecture.
Related reading: How to Lower TCO and Increase ROI with Embedded Analytics

Yellowfin BI pricing summary
To ensure you find the perfect fit, Yellowfin offers a few ways to get started.
In addition to its pricing plans, you can book a free live demo with our technical experts to see how the platform works with your own data beforehand. Yellowfin also provides proof-of-concepts (POC) at no charge, so you can test the solution's value before making any commitments. Select pricing plans have starting prices as low as USD $19.00 per month.
Overall, Yellowfin provides a number of simple, scalable options for organizations looking to buy the best and most affordable embedded analytics solution available on the market.
What is Microsoft Power BI's pricing model?
Now let's look at Power BI, Microsoft's analytics solution.
Power BI offers a pricing model that includes both a free version and paid plans. While the free version can be tempting, it comes with key limitations, such as a smaller data capacity and a lack of collaboration features.
For any organization that needs advanced capabilities, an upgrade to a paid plan is necessary. Power BI offers three paid tiers to choose from: Power BI Pro, Power BI Premium, and Power BI Embedded.
1. Power BI Pro
Power BI Pro is priced per user at a monthly rate of $15, and is primarily geared toward organizations who want to license individual users with analytics and dashboard/data visualization capabilities. For example, you need 20 licenses of Power BI Pro to give 20 users full access to creation of reports and unlimited consumption (viewing) of any created content.

Read our detailed comparison guide on Yellowfin vs Power BI for more information.
2. Power BI Premium
Power BI Premium is priced per user at a monthly rate of $29.90 USD, and is primarily geared toward organizations who want to license individual users with the advanced part of its analytics suite, including data preparation for big data, and enterprise-level management and deployment.
Power BI Premium also has a per capacity pricing tier at $7,475.30 USD per month, which is geared toward organizations who want the entirety of the business to have access to Power BI’s advanced feature-set. The licensing includes users, datasets, and content.
3. Power BI Embedded
Power BI Embedded is based on a pay-as-you-go, hourly rate for capacity, not per user. The capacity tiers that Microsoft offers are known as Azure SKUs, with the lowest offering 1 virtual core and 3GB memory. Microsoft provides a pricing calculator for personalized estimates. The price increases with each higher tier (A2-A6), as the number of virtual cores and RAM increases.
Read comparison: Power BI Embedded - Is it Your Best Choice for Analytics and Reporting?
Power BI pricing summary
Power BI is heavily tethered to the Microsoft 365 and Microsoft Azure Cloud ecosystems, making it attractive for organizations who want to fully integrate with only the MS software stack for their infrastructure and data needs. Finally, Microsoft notes that currency, country and regional variations can affect the final pricing per user or organization.
When looking at Power BI alternatives, Yellowfin stands out because Power BI’s per-user pricing can quickly escalate for large teams, while Yellowfin offers more flexible licensing options and embedded analytics capabilities at competitive rates.
What is Tableau's pricing model?
A common query we hear is what are the Tableau license types and the cost? Compared to other vendors, Tableau's pricing model consists of Creator, Explorer, and Viewer user types, offering varying degrees of functionality.
1. Tableau Creator
Tableau Creator license cost is priced per user at a monthly rate of $75 USD (billed annually). It is primarily geared for organizations who want to license one user with advanced administration, governance, data prep and content authoring and collaboration capability (i.e. admins, analysts and managers). This tier bundles Tableau Desktop, Tableau Prep Builder and one creator license on Tableau Cloud.
2. Tableau Explorer
Tableau Explorer is priced per user at a monthly rate of $42 USD (billed annually), and is focused on organizations who want to license individual users with self-service analytics and dashboard/data visualization capabilities (i.e. regular analytics users within the organization). This tier only includes Explorer licensing for Tableau Cloud.
Read our detailed comparison guide on Yellowfin vs Tableau for more information.
3. Tableau Viewer
Tableau Viewer is priced per user at a monthly rate of $15 USD (billed annually), and is primarily geared toward organizations who want to license individual users with the ability to view and use basic interactions with dashboards and data visualizations (i.e. irregular users or end-users who only consume but not create data content). This tier only includes Viewer licensing for Tableau Cloud.
Tableau pricing summary
Tableau offers some flexibility in its pricing, but hidden costs may arise if organizations need to allocate more Creator or Explorer licenses to accommodate increased user demand or advanced features.
Additionally, organizations should be aware of potential costs associated with consulting services, training, and support, which are not explicitly outlined on Tableau's pricing page.
Compared to Yellowfin, Tableau can be expensive for teams scaling analytics, which offers ease of use, embedded analytics, competitive pricing, and seamless Yellowfin integration with multiple data sources, simplifying dashboard deployment across the organization.
What is Sisense's pricing model?
Sisense offers a straightforward pricing model tailored for SaaS companies and independent software vendors (ISVs) seeking to embed analytics into their applications. Their pricing is customized based on individual business needs, focusing on scalability and integration.
1. Self-hosted plans
These plans start around $10,000 per year for small teams. Ideal for organizations that want full control over infrastructure and data security.
2. Cloud-hosted plans
The cloud plan begins at near $21,000 annually for five users, which can be pricey for small-to-mid organizations. This makes this model best suited for teams seeking quick deployment without maintaining on-premise servers or requiring larger numbers of users to access the analytics module.
3. Enterprise-level plans
The enterprise specific plan can reach up to $327,000 per year, depending on features and scale. Provides advanced analytics, AI capabilities, and priority support for large organizations.
Sisense pricing summary
Sisense pricing is tailored for embedded analytics and scalable to growing organizations. Businesses can request a demo or contact Sisense for a personalized quote.
In contrast, Yellowfin’s pricing is more transparent and predictable for embedded analytics, with packages designed to suit both SMBs and enterprise-level organizations. Yellowfin also provides strong BI and dashboard features without the high upfront costs that Sisense’s enterprise plans may require.
Related reading: Yellowfin vs Sisense
What is Qrvey's pricing model?
Qrvey provides a flat-rate pricing model specifically designed for SaaS providers and ISVs looking to embed analytics without incurring unpredictable costs.
1. Flat-rate pricing
Unlimited users, dashboards, and environment deployments. This makes budgeting simple and predictable for organizations of all sizes.
2. Custom pricing
Tailored solutions to scale with business requirements. Pricing adapts to your usage, ensuring you only pay for what you need while accommodating future growth.
Qrvey pricing summary
Compared to Yellowfin, Qrvey’s flat-rate model is simple, but may lack some advanced analytics features and integrations offered by Yellowfin.
Yellowfin delivers a more robust analytics platform with flexible deployment options and competitive pricing for growing organizations.
Read our comparison guide: Yellowfin vs Qrvey: What's the difference?
What is Qlik Sense's pricing model?
Qlik Sense offers a subscription-based pricing model designed for businesses of all sizes, emphasizing flexibility and scalability.
1. Standard plan
$825 per month for 25 GB of data, billed annually. Ideal for small to mid-sized teams needing essential analytics features and moderate data capacity.
2. Premium plan
$2,700 per month, including 20 full-user licenses and 10,000 basic user licenses. Designed for larger organizations requiring extensive user access and higher data processing capabilities.
Qlik sense pricing summary
Qlik Sense’s plans are flexible and scalable, suitable for businesses of all sizes seeking embedded or enterprise analytics. While Qlik cost can escalate for larger deployments, Yellowfin provides similar advanced analytics features at competitive rates and with a simpler pricing structure.
What is Upsolve AI's pricing model?
Upsolve AI provides tiered plans suitable for startups, growing businesses, and enterprises that scale with the familiar pay-as-you-go model (based on capacity and features needed).
1. Launch plan
Upsolve's standard tier is $300 per month, ideal for early-stage startups. It offers essential analytics tools to help teams make data-driven decisions without overcomplicating the process.
2. Growth plan
$1,000 per month, offering advanced analytics and dashboards. Includes integration with multiple data sources and enhanced reporting capabilities for scaling businesses.
3. Enterprise plan
Custom pricing based on organizational scale and requirements. Provides full customization, priority support, and enterprise-grade features to meet complex business needs.
Upsolve AI pricing summary
Upsolve's tiered pricing balances affordability with enterprise functionality. Costs may increase for additional users, advanced integrations, or expanded analytics capabilities.
Compared with Yellowfin, Upsolve AI may require extra investment for integrations and scaling users, whereas Yellowfin offers bundled features, embedded analytics, and multi-department access at a cost-effective price. This makes Yellowfin a more comprehensive solution for growing organizations.
Comparing embedded analytics pricing models
When analyzing different analytics pricing models, it’s important to understand how various approaches impact costs, scalability, and feature access.
- Seat-based/user pricing: Charges depend on the number of users accessing the platform. Costs can rise quickly as user numbers grow, and some embedding features may require extra paid add-ons.
- Usage-based pricing: Billing is based on data volume, API calls, or compute resources. Flexible for low usage, but can become unpredictable as usage increases.
- Feature-based pricing: Costs vary by enabled functionalities, like AI tools or white-labeling. Paying only for needed features is efficient, but scaling can add unexpected expenses.
- Flat/fixed pricing: A set fee covers unlimited users and dashboards. Offers predictability and scalability, though it may require long-term commitments or upfront investments.
Aligning with your needs
- Large or variable user bases: Organizations anticipating large or variable user bases often benefit most from flat or fixed pricing plans that provide financial predictability.
- Specific features: Teams focused on specific advanced features but with constrained usage might find feature-based pricing models a good fit, but should plan for potential costs to unlock additional capabilities.
- Associated costs access: It is essential to assess all associated costs, including support, training, and integration, to ensure a comprehensive understanding of long-term expenses.
Evaluating analytics pricing: Conclusion
When evaluating embedded analytics pricing, it’s essential to consider hidden costs like support, maintenance, and training, which can vary by vendor. Scalability is also key; pricing may change as usage or user numbers grow.
For instance, Yellowfin’s Aligned Utility Model adjusts costs based on usage and deployment. By looking beyond base pricing and assessing long-term needs, organizations can make informed decisions and avoid unexpected expenses.
Frequently asked questions (FAQs)
How do embedded analytics solutions impact IT workload?
They reduce IT workload by enabling self-service reporting, but still require IT for setup, integration, and maintenance.
Can embedded analytics be customized for industry-specific needs?
Yes, most platforms allow customization to meet industry-specific KPIs, workflows, and compliance requirements.
How secure are embedded analytics solutions for sensitive data?
Enterprise-grade solutions offer encryption, access controls, and compliance certifications to protect sensitive data.
What are the key considerations beyond base pricing?
Hidden costs, such as API usage, data migration, or premium support, can increase total expenses, so plan ahead. Scalability may increase costs as user numbers or data volumes grow, and integration or customization features often incur additional fees.
How much does embedded analytics cost?
Embedded analytics pricing varies based on the vendor, deployment model, and scale of usage. Some solutions offer entry-level plans starting under $20 per month, while enterprise deployments can range from several thousand to hundreds of thousands of dollars annually depending on users, server capacity, and advanced features.
What are the different pricing models for embedded analytics?
Common embedded analytics pricing models include:
- Seat-based or named-user pricing
- Usage-based pricing tied to data volume or compute capacity
- Revenue-share models for SaaS providers
- Server or core-based pricing
- Flat or fixed pricing models
Each model impacts long-term cost predictability and scalability differently.
What is the difference between seat-based and usage-based BI pricing?
Seat-based pricing charges per licensed user, making costs predictable for stable teams. Usage-based pricing charges based on system consumption such as API calls, queries, or server resources, which can fluctuate depending on growth and customer activity.
Why does embedded analytics pricing increase as a company scales?
Pricing may increase due to higher user counts, expanded data processing needs, additional feature upgrades, or infrastructure expansion. As organizations grow, licensing tiers or server requirements often change to support performance and access.
How is Power BI Embedded priced compared to traditional BI licensing?
Microsoft Power BI Embedded uses a capacity-based, pay-as-you-go pricing model tied to Azure resources rather than per-user licensing. Traditional BI licensing models often charge per named user or per feature tier.
What should businesses consider before choosing an embedded analytics pricing model?
Organizations should evaluate projected user growth, infrastructure requirements, feature needs, integration complexity, and long-term scalability. Understanding total cost of ownership beyond base subscription pricing is critical before committing to a vendor.
Yellowfin Pricing: Flexible and Tailored For You
Yellowfin pricing is simple, predictable and scalable. Learn more about our flexible pricing plans for embedded analytics and enterprise BI today.