
What's new in Yellowfin 9.1
See how Yellowfin 9.1 provides business users with unique ways to engage with and act on their data, and addresses the needs of data analysts and developers who want to build and deploy amazing analytical experiences.

New Feature Highlights
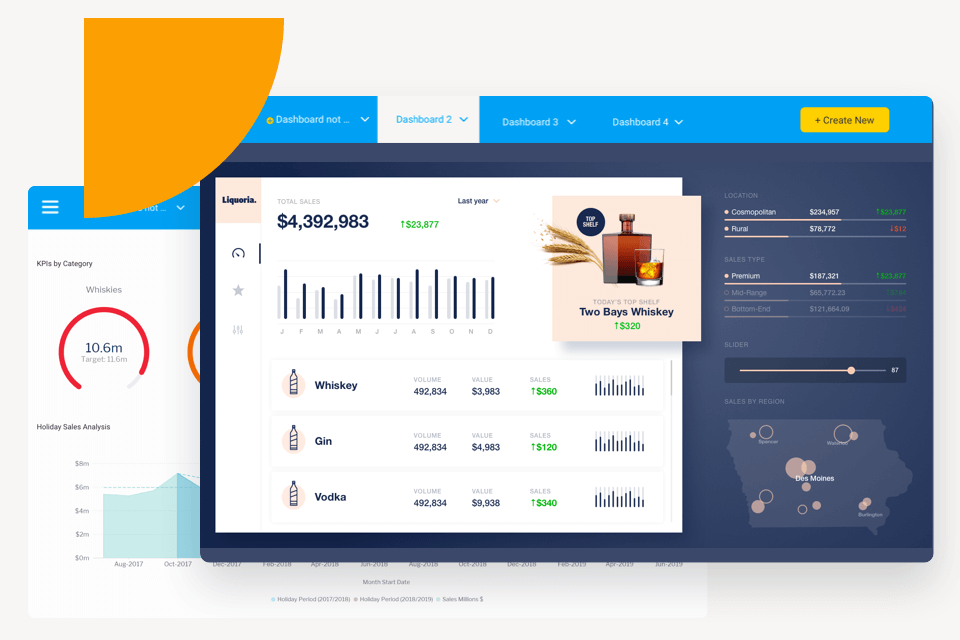
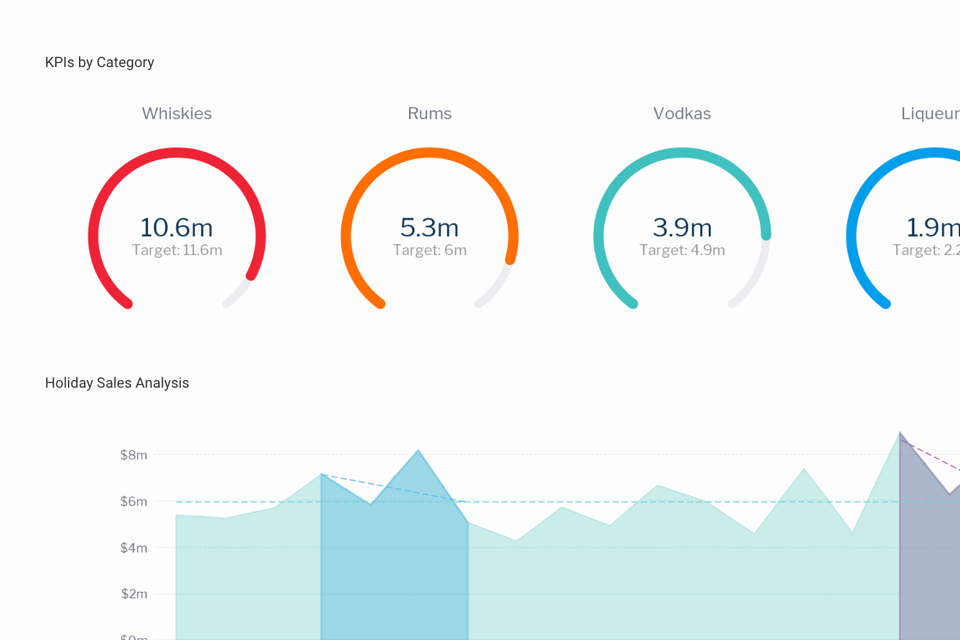
Create beautiful and meaningful dashboards
If you can think it, you can build it. Assemble creative, on brand infographic and actionable dashboards on a flexible, free-form canvas with our new dashboard builder.
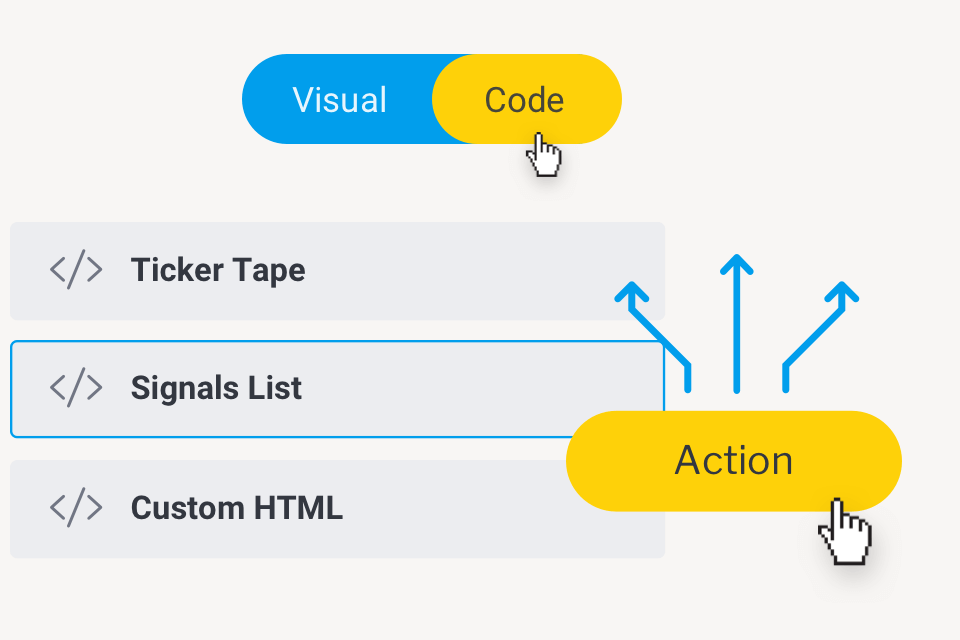
Build actionable and engaging experiences on the fly
Extend dashboard functionality with our new Code Mode, Code Widgets, and Actions - enabling developers to create custom, actionable, and rich application experiences that we haven’t even thought of. Perform deeper integration and embedded analytics with an enhanced Javascript API that is both contextual and state-aware.
Collaborate and short cut the design process
Put the pen and paper away. Rapidly wireframe that perfect dashboard with Blueprint and collaborate with analyst, designers, and developers. Short cut your dashboard design process by creating reports and charts directly on the dashboard with auto-configured properties. Less clicks all around.
Blueprint
Put the pen and paper away.
Quick Charts
Short cut your dashboard design process.

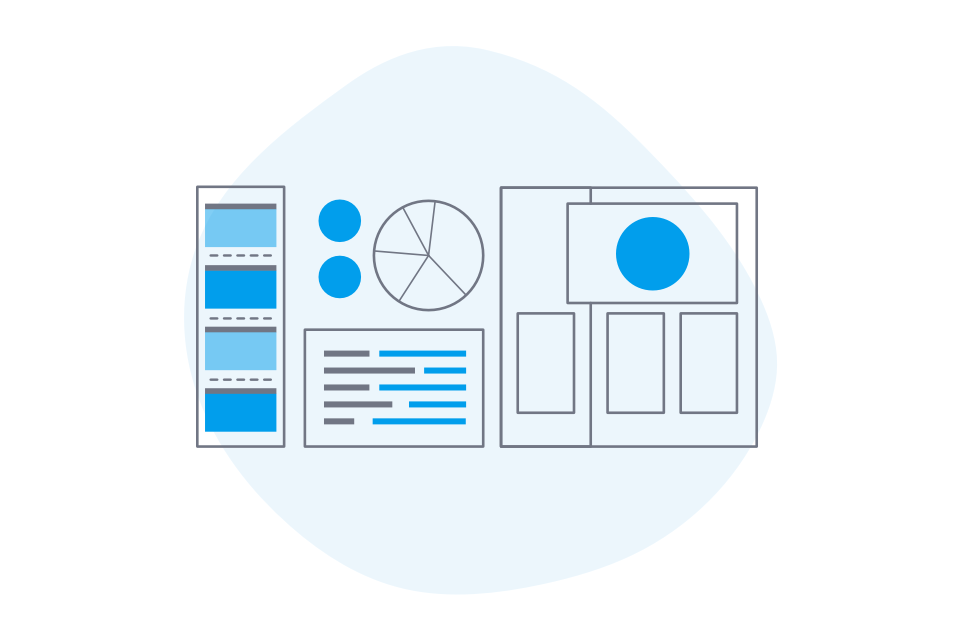
Dashboard Canvas
If you can think it, you can build it.
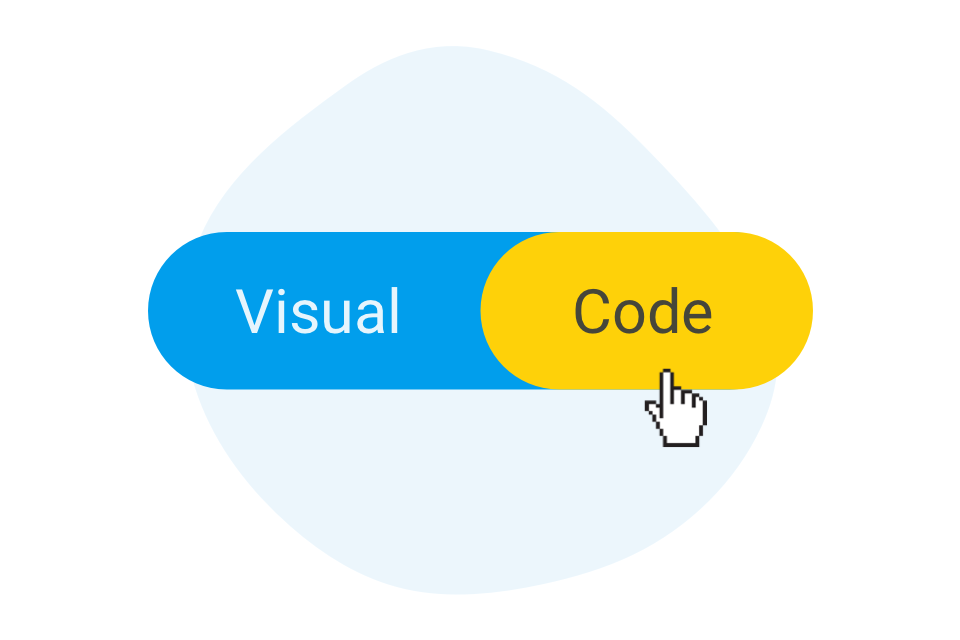
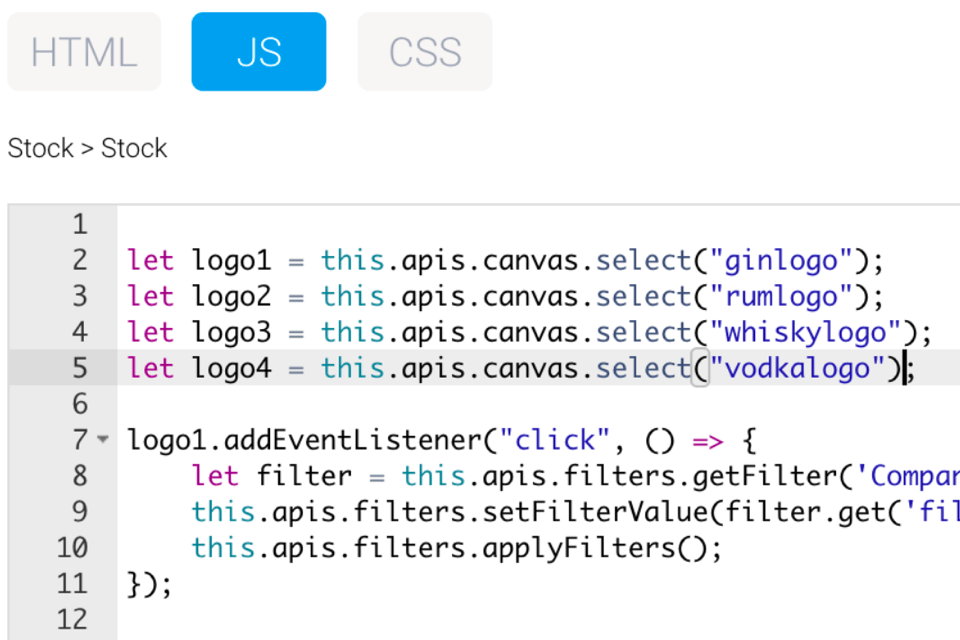
Code Mode
A new bilateral editor to help you create experiences we haven't even thought of.
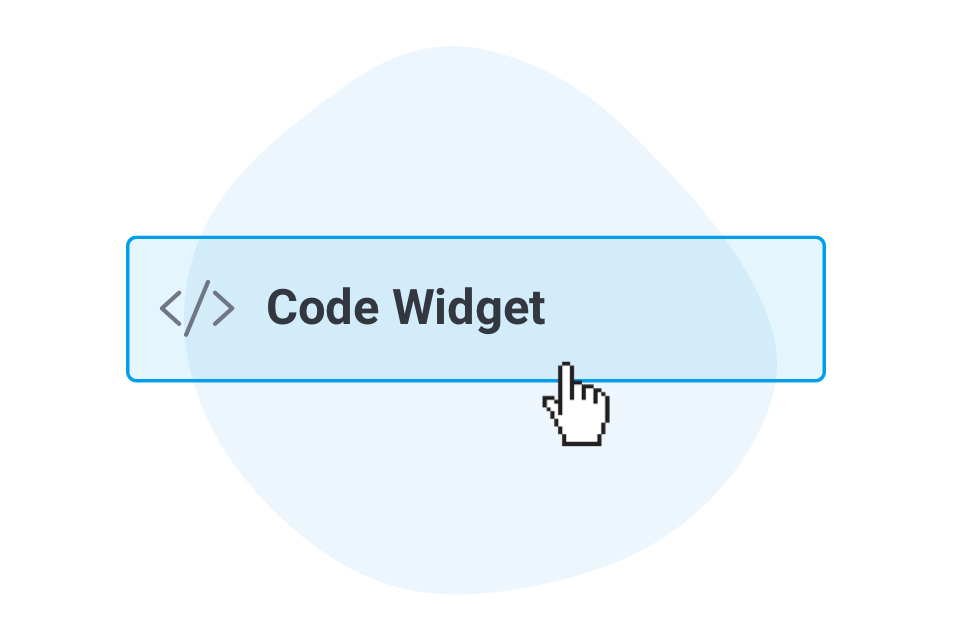
Code Widgets
Leverage low-code/no-code widgets in your dashboards.
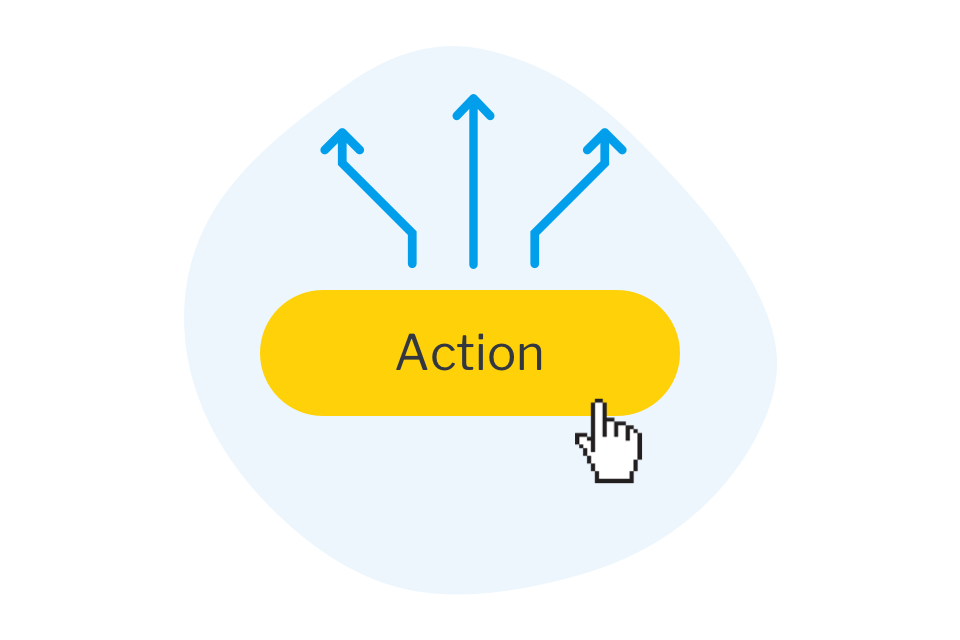
Action Buttons
Take direct action within the dashboard and close the loop in decision-making.
JavaScript API
An actionable dashboard requires an actionable API.
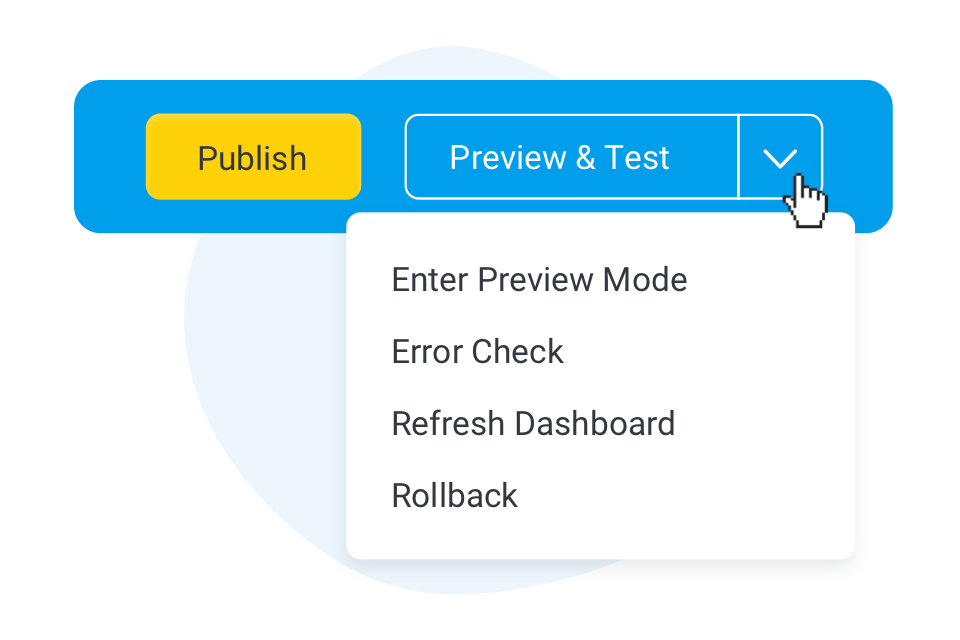
Preview Mode
Design and preview dashboards before they go live.
Report Branching
Utilize multiple charts within a report.
Snapshots and Bookmarked Reports
Add Snapshots and bookmarked reports to the dashboards.
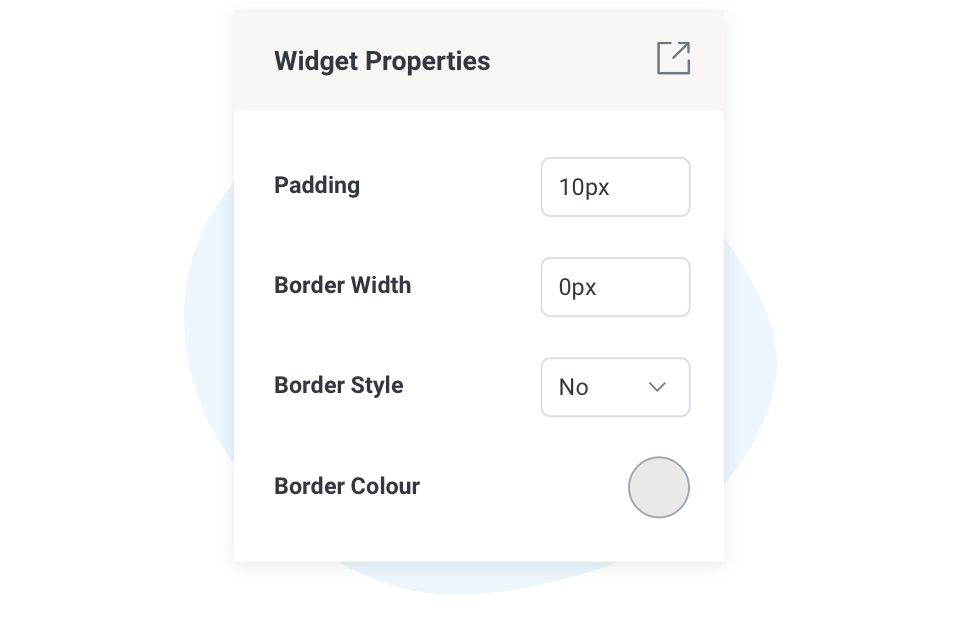
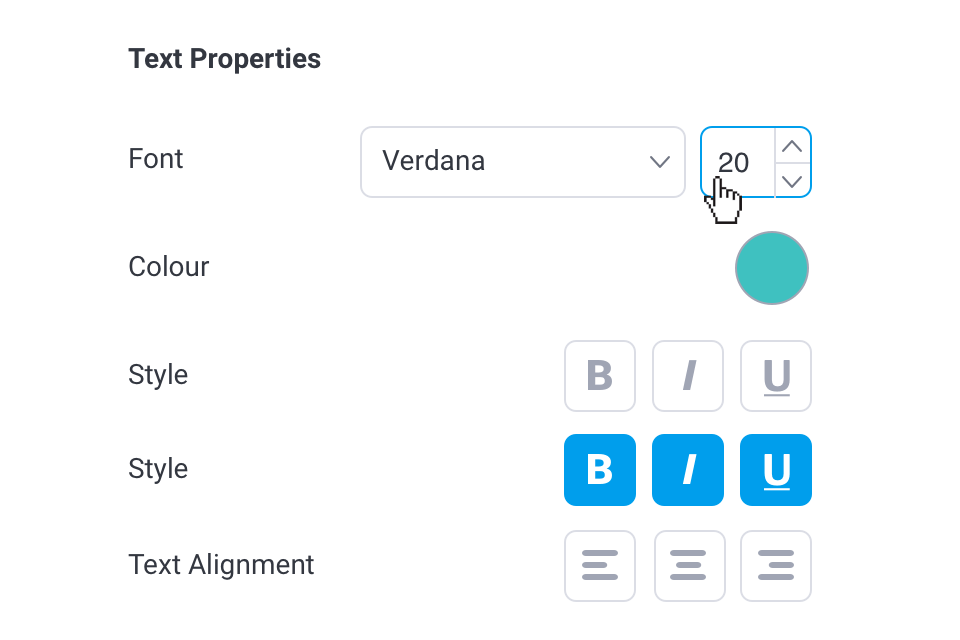
Enhanced Properties Panel
Setting object properties just got easier.
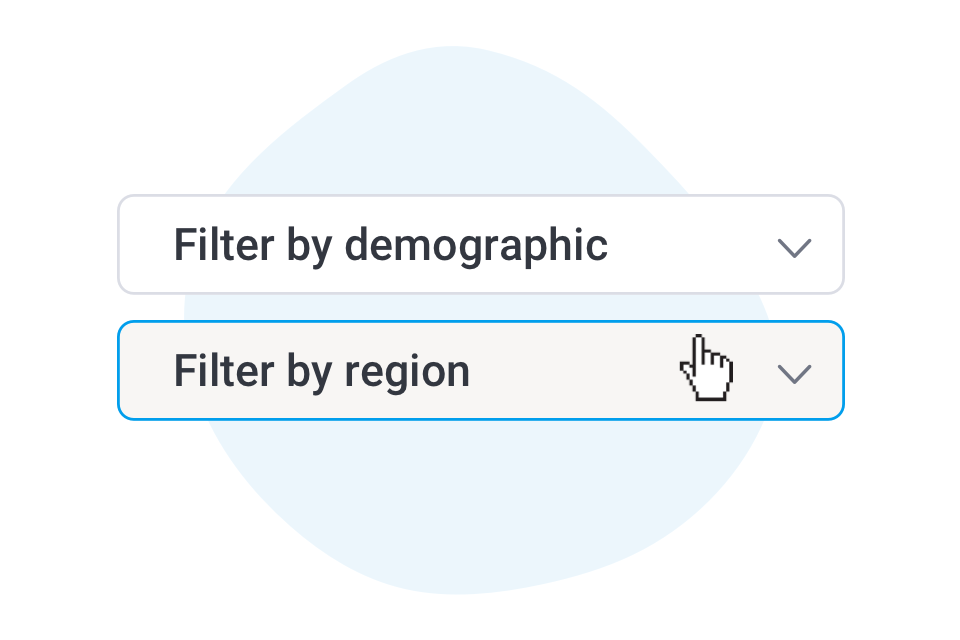
Filters on Dashboard Canvas
Drop filter panels directly onto a canvas.
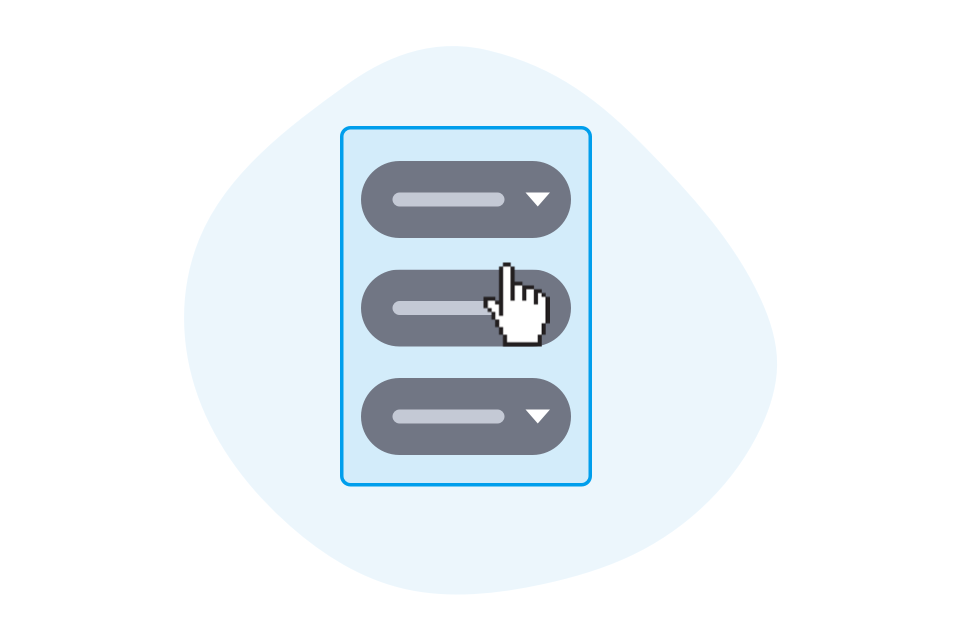
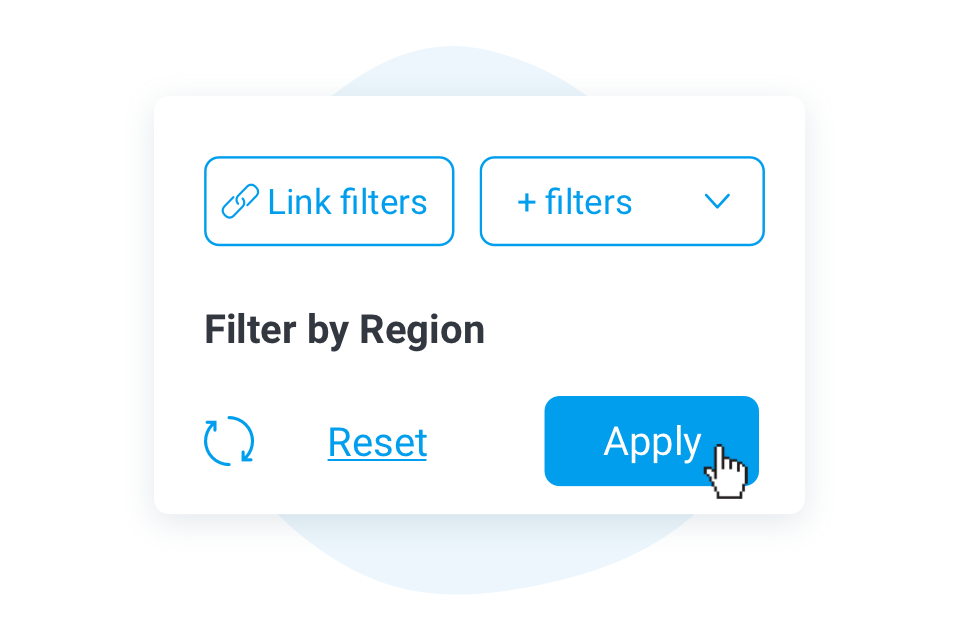
Restyled Filters
Dashboard filters get a makeover.
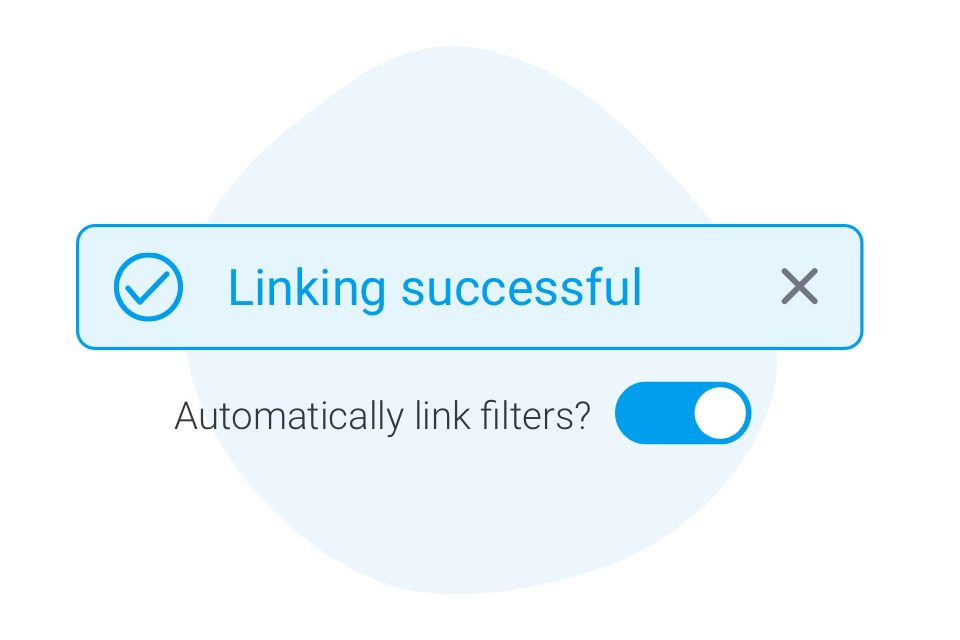
Filter Auto Linking
Let us do the wiring for you.

Enhanced Dashboard Filter Properties
Connect individual dashboard filters to seperate SubTabs.
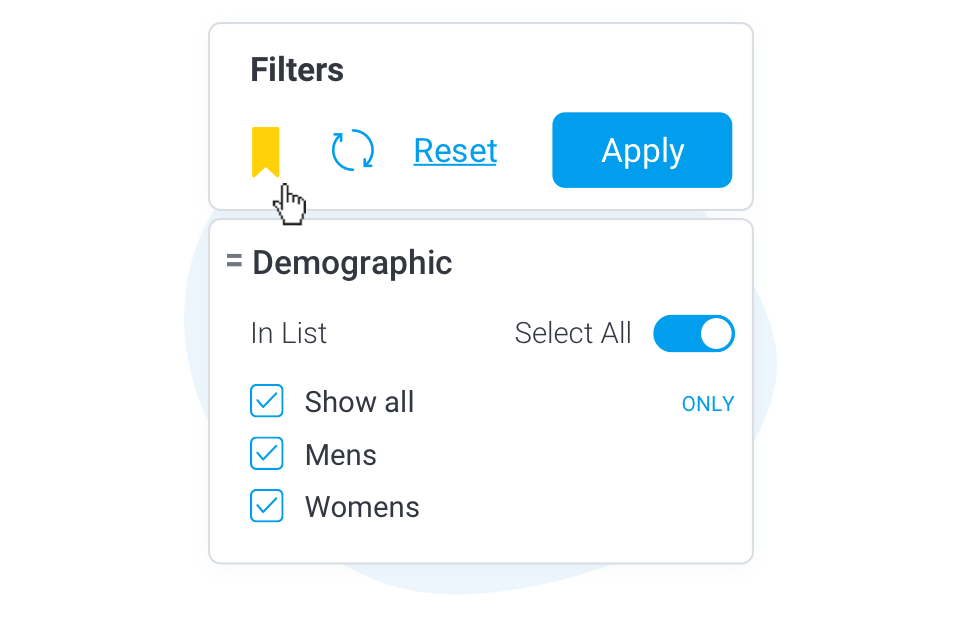
Dashboard Filter Bookmarks
Bookmarks are now available for Dashboards.
Edit Report
Stay within your workflow as you create dashboards.
Multiple Usage of Same Report
Use awesome reports again and again.
Simplified Dashboard Sharing
Set sharing permissions without editing dashboards.

Undo / Redo
Reverse changes on the dashboard.
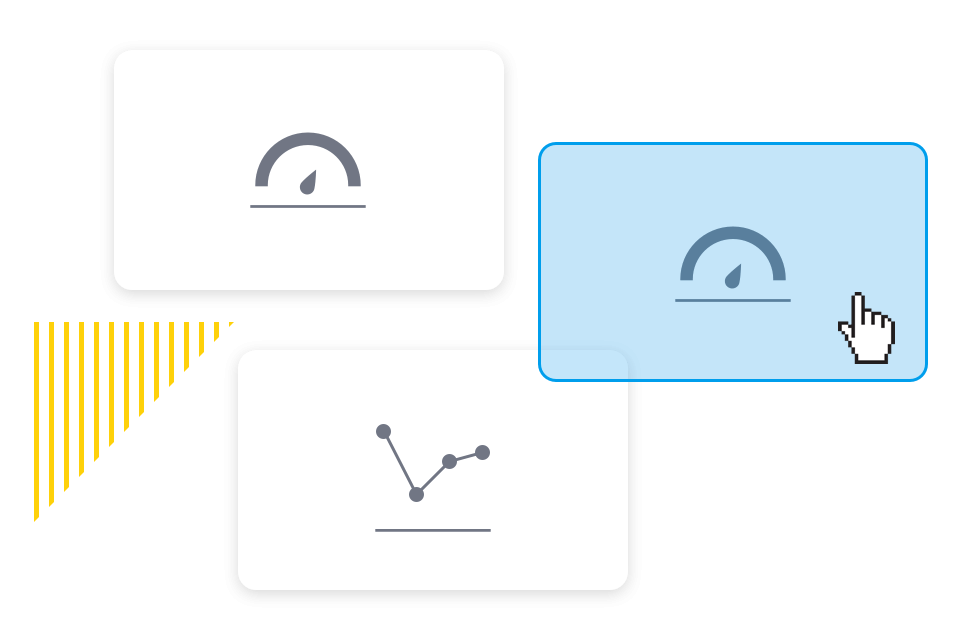
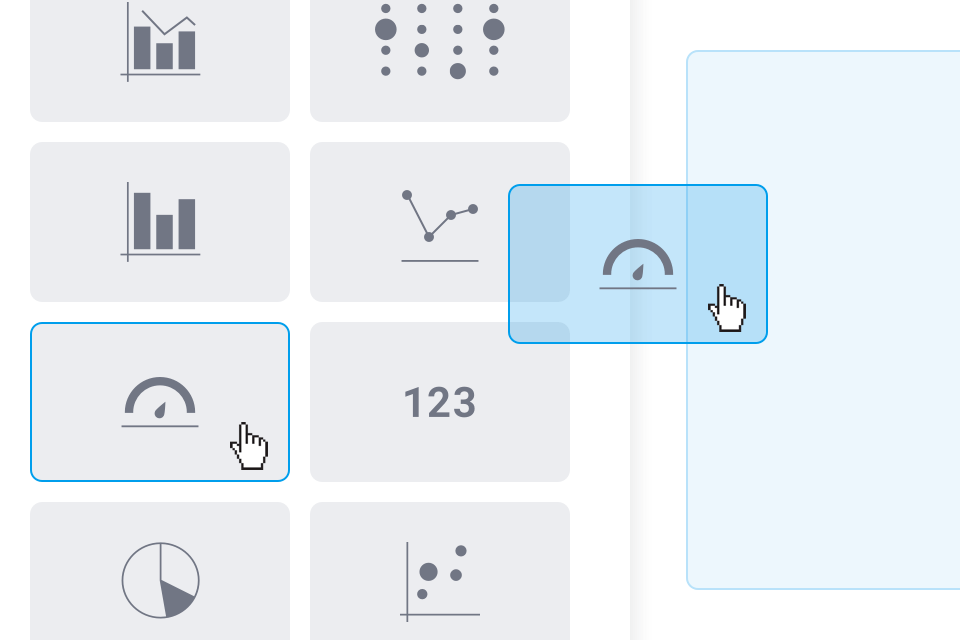
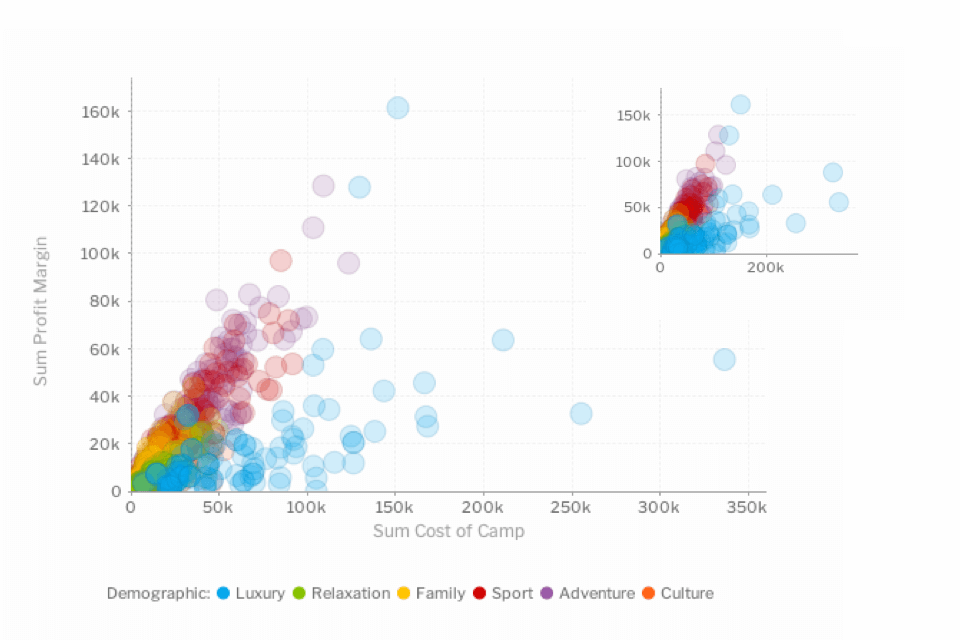
Smart Chart Defaults
Simply choose the chart type and let us do the work for you.
New Default Colours and Fonts
New fonts and colour palettes for charts and dashboards.
Enhanced Colour Scheme Setup
Set your colours the same way for all kinds of charts.
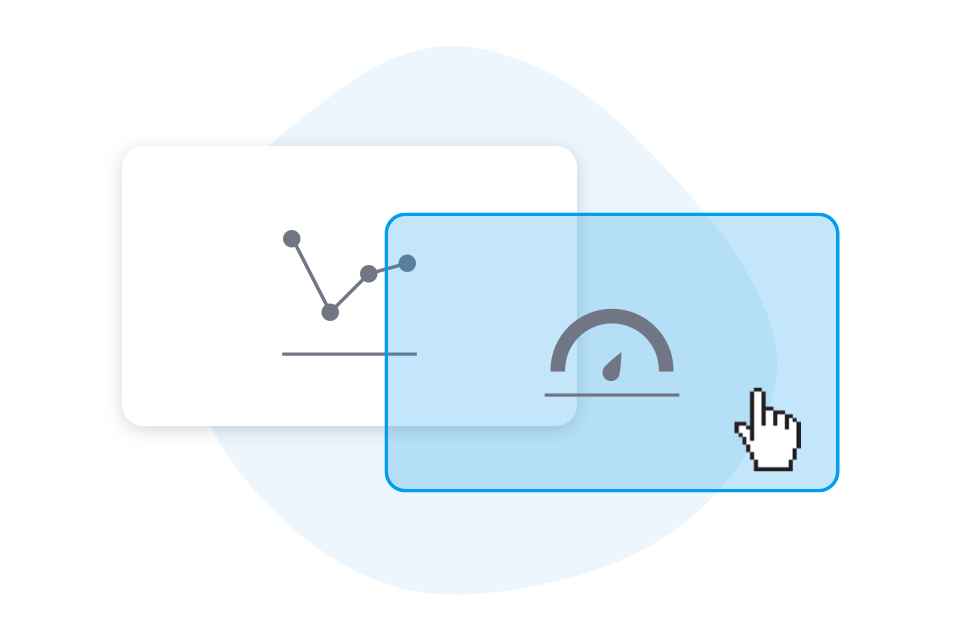
Smart Chart Logic
Chart formatting should look good in all sizes, all the time.
Yellowfin Present
Goodbye Storyboards, Hello Present.

REST API
Easily integrate AI-powered analytics into your apps.

Font Upload
Be on brand with your own fonts.
Present Themes
Design Once, Use Anywhere
SparkLine Formatter
Show visual data trends in your tabular reports
Report Action Buttons
Take direct action within the report and close the loop in decision-making
In more detail...
Blueprint
Rapidly wireframe that perfect dashboard with Blueprint. Annotate and collaborate with both analysts and designers and see it get built in real-time.
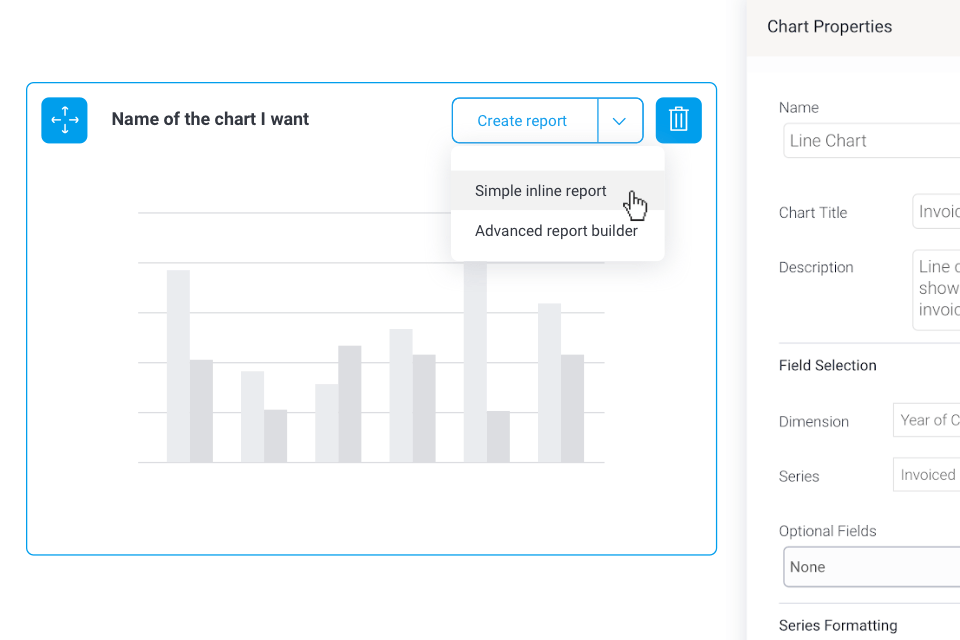
Quick Charts
Create charts directly on the dashboard with a new Quick Chart workflow with auto-configured chart properties. Less clicks all around.

Dashboard Canvas
Design creative infographics and actionable dashboards on a free-form, pixel perfect canvas layout that are both stunning and engaging.
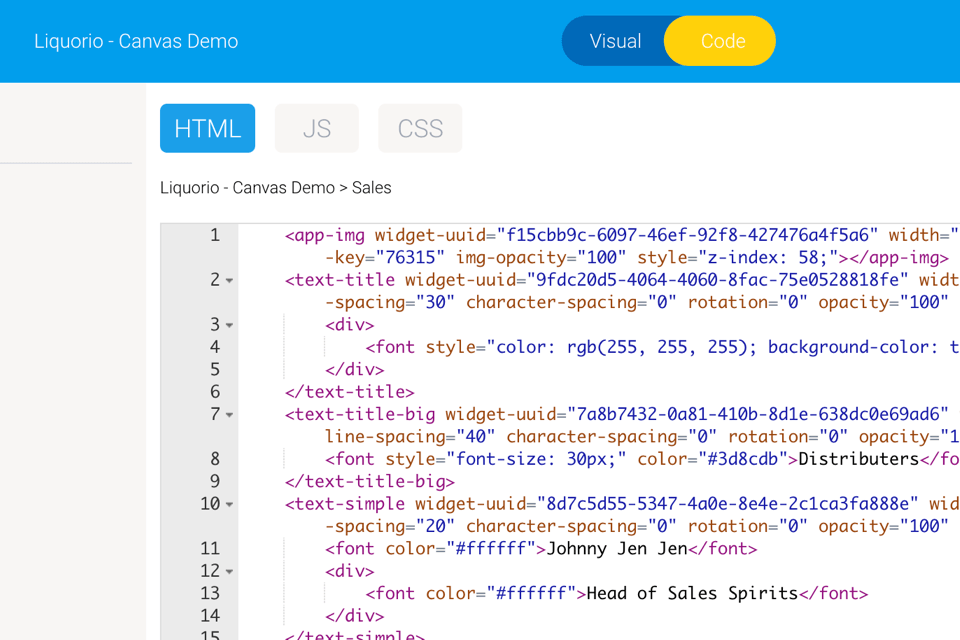
Code Mode
Swap between visual and code modes with the bilateral editor and edit dashboard code with HTML, Javascript and CSS. Developers can now extend dashboard functionality within Yellowfin and create rich application experiences that we haven't even thought of.
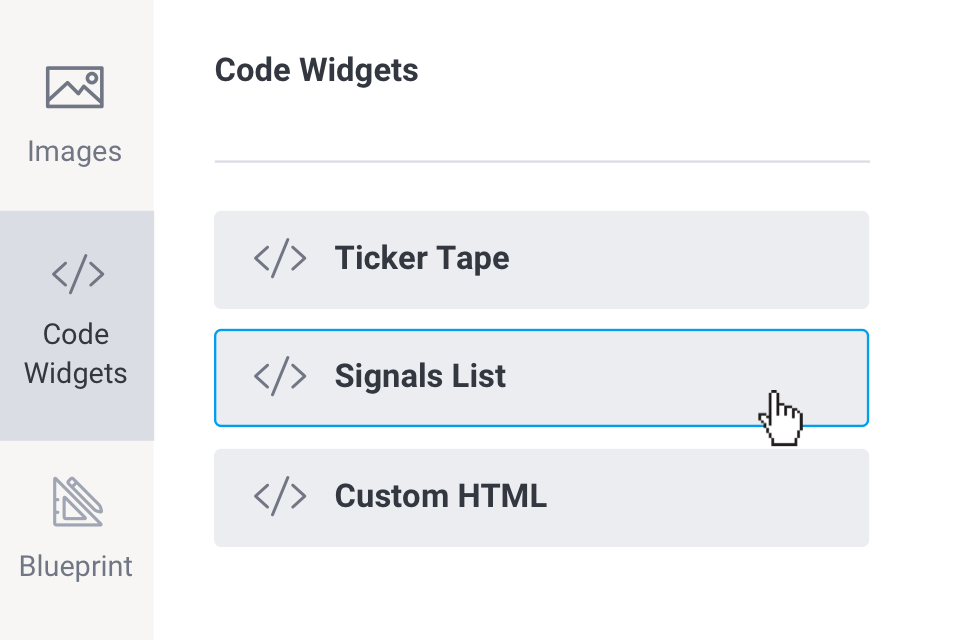
Code Widgets
Use code widgets to operationalize custom interactivity and consumption into your dashboards. Better still, save your awesome code mode integrations for re-use by other dashboard authors in your organization.
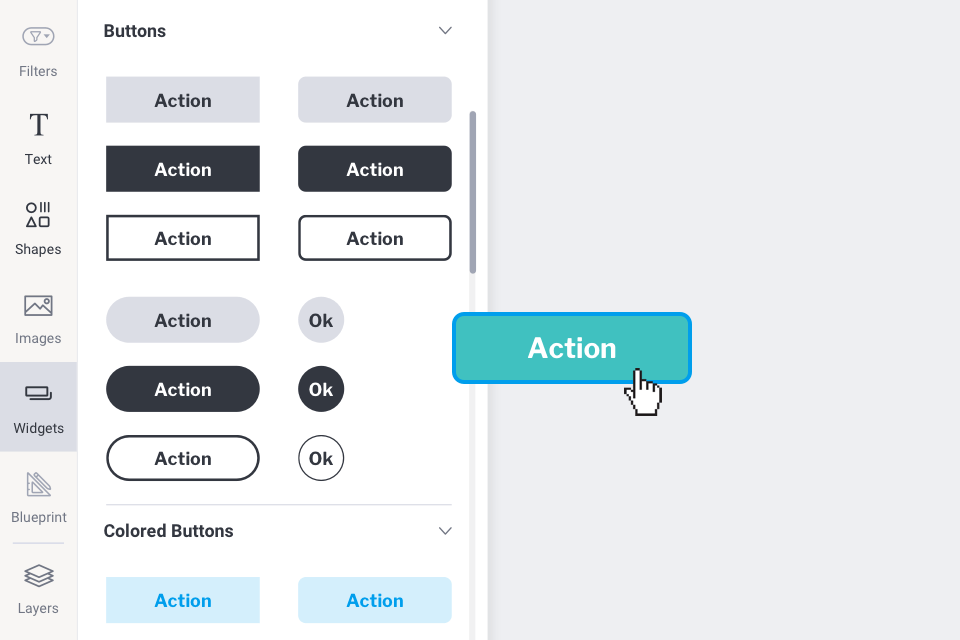
Action Buttons
Use out-of-the-box Yellowfin actions, integrate workflows to third party applications or create your own custom action pipelines that do more.
JavaScript API
The enhanced Javascript API brings contextual and state-aware APIs to the dashboard canvas and every object in it. Easily embed parts or the whole dashboard into your application and manage interactivity between objects at the most granular levels.
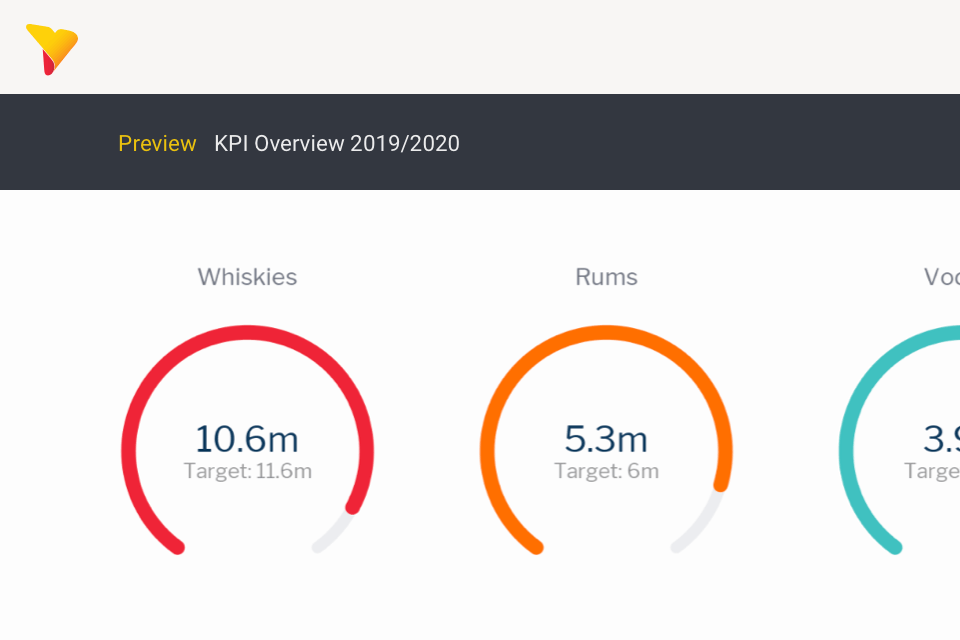
Preview Mode
Just like Stories, Preview Mode has been introduced to Dashboard to allow you and others to rapidly test and preview a dashboard before it gets published and shared.

Report Branching
Select multiple charts from the same report and place them anywhere on the canvas - all without running the SQL multiple times.
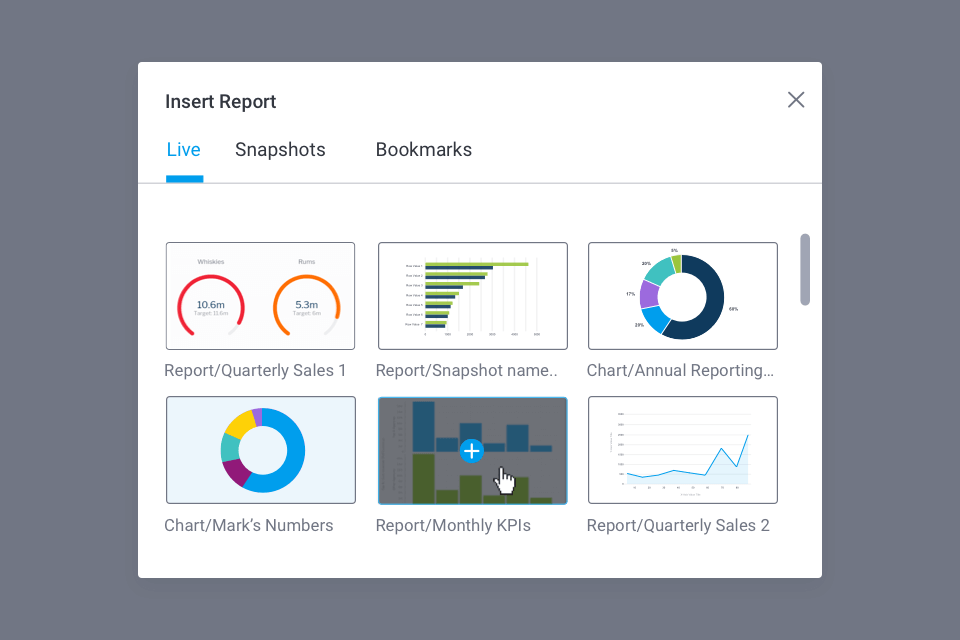
Snapshots and Bookmarked Reports
The all-new user interface also detects different types of content within a report and allows you to choose a specific chart, snapshot or bookmark.
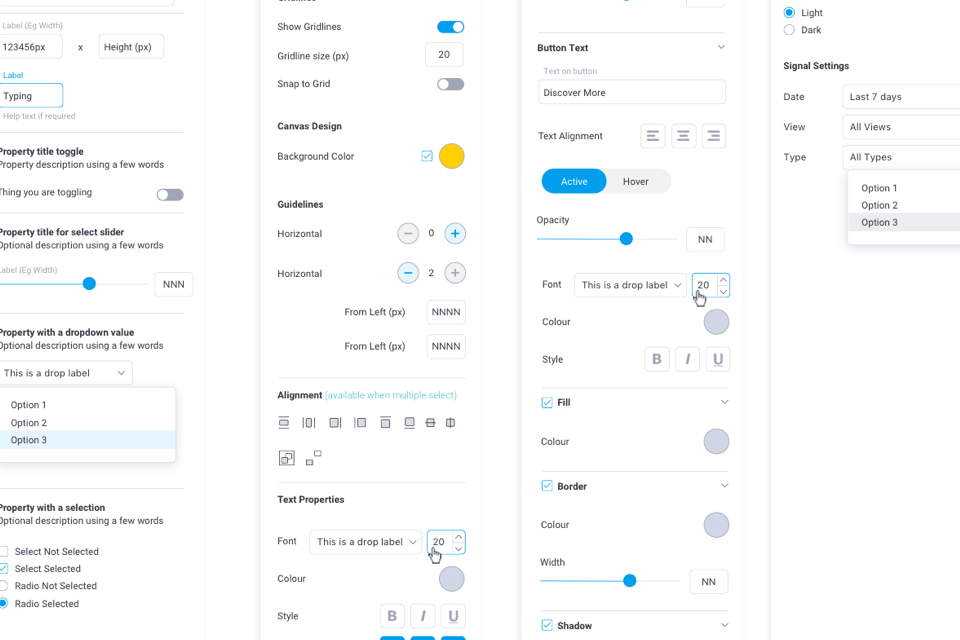
Enhanced Properties Panel
Improvements to dashboard objects' properties panel continue to make it more contextual and user-friendly. You can now also link dashboard interactions (Brushing, Drill downs, Time Sliders, etc) from the same panel.
Filters on Dashboard Canvas
You can now add a filter panel directly onto a dashboard canvas with both vertical and horizontal orientations.
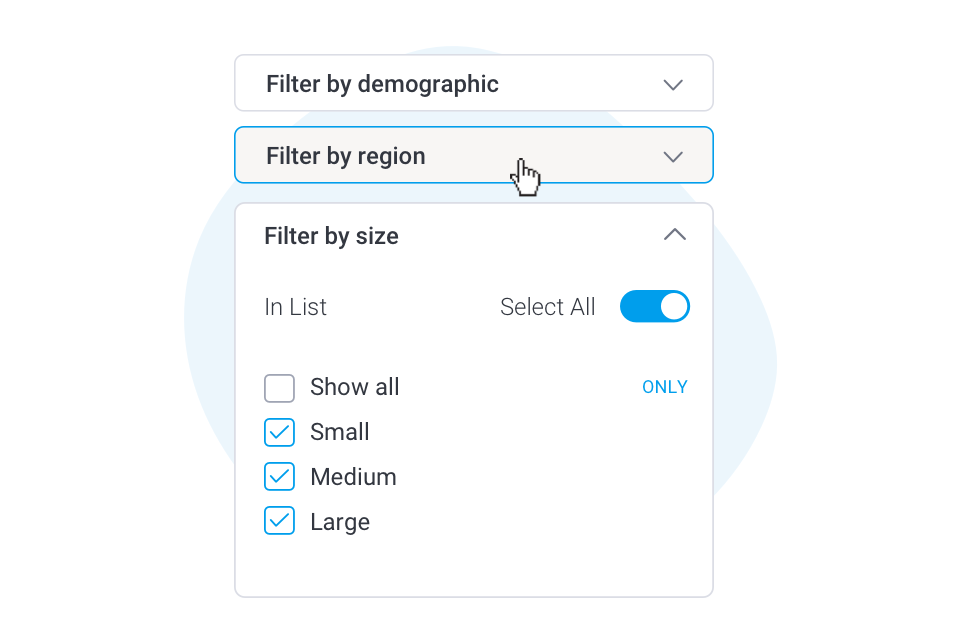
Restyled Filters
Dashboard filter panel styling has been refreshed. You now also have the ability to modify the CSS through code mode and rapidly create custom looking filter panels.
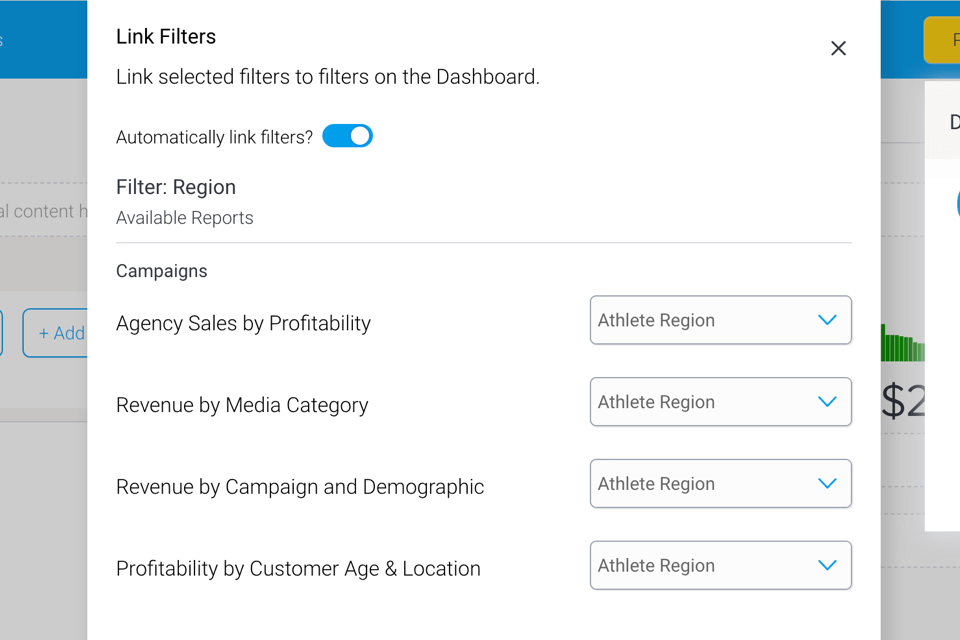
Filter Auto Linking
Linking multiple reports with filters on a dashboard is now done automatically for reports from the same data model. Just drag your report onto the canvas and let Yellowfin do the work for you.
Enhanced Dashboard Filter Properties
Dashboard filters can now apply to specific SubTabs vs all SubTabs. You can also set individual settings (default values, list vs checkbox, etc) for each dashboard filter.
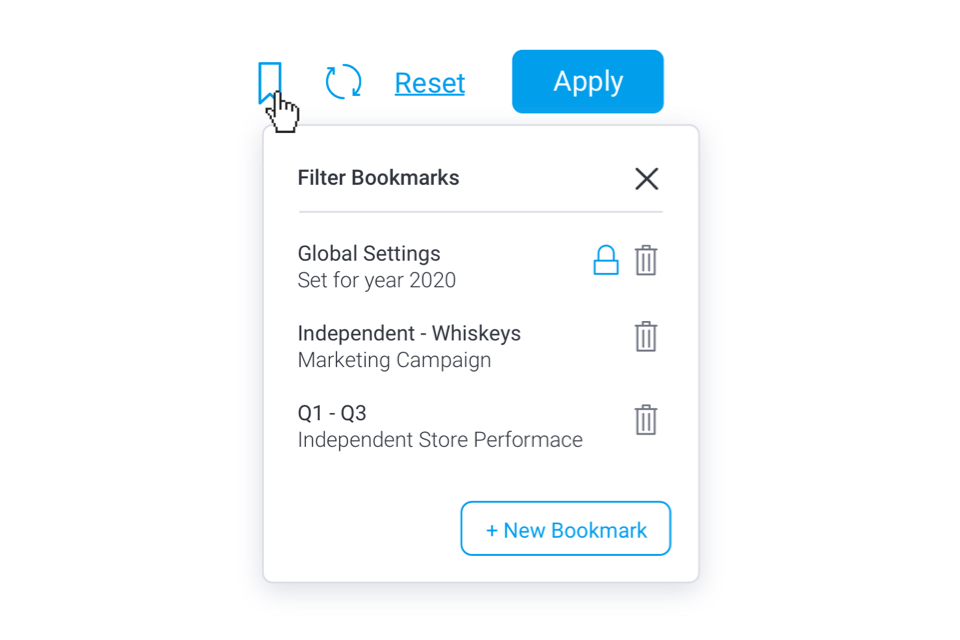
Dashboard Filter Bookmarks
You can now apply bookmarks to dashboard filters and run saved bookmarks.

Edit Report
You can now edit reports with a single click when building a dashboard. Once you're done, the workflow will seamlessly return you to the dashboard canvas.

Multiple Usage of Same Report
A report can now be used multiple times on the same dashboard, enabling you to apply different bookmarks within the report and use them accordingly.
Simplified Dashboard Sharing
Dashboards sharing has been simplified to enable you to set share recipients and permissions without editing the dashboard.
Undo / Redo
The dashboard builder now supports undo and redo for multiple changes on the canvas.
Smart Chart Defaults
Smart chart defaults for fonts, visual formatting, padding and styles are automatically applied to make your charts look great out-of-the-box with as little effort as possible.
New Default Colours and Fonts
Your charts and dashboards now look even more stunning with new colour and font defaults.
Enhanced Colour Scheme Setup
Improvements to colour scheme setup for charts continue to make the experience more uniform for both auto-and-bespoke charts.
Smart Chart Logic
Charts elements now automatically switch off or re-order themselves - axis labels, ticks, legends - according to the allocated size on the dashboard.
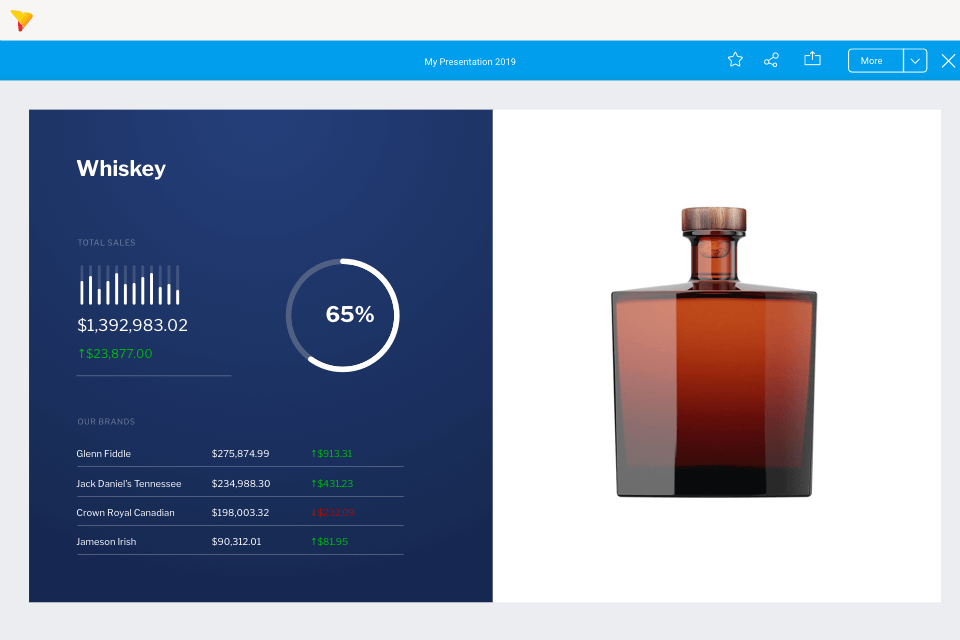
Yellowfin Present
Communicate the significance of your data-driven insights with a fully integrated presentation module, Present. Now sharing the dashboard builder experience with even more interactive widgets, actions and content for that perfect deck.
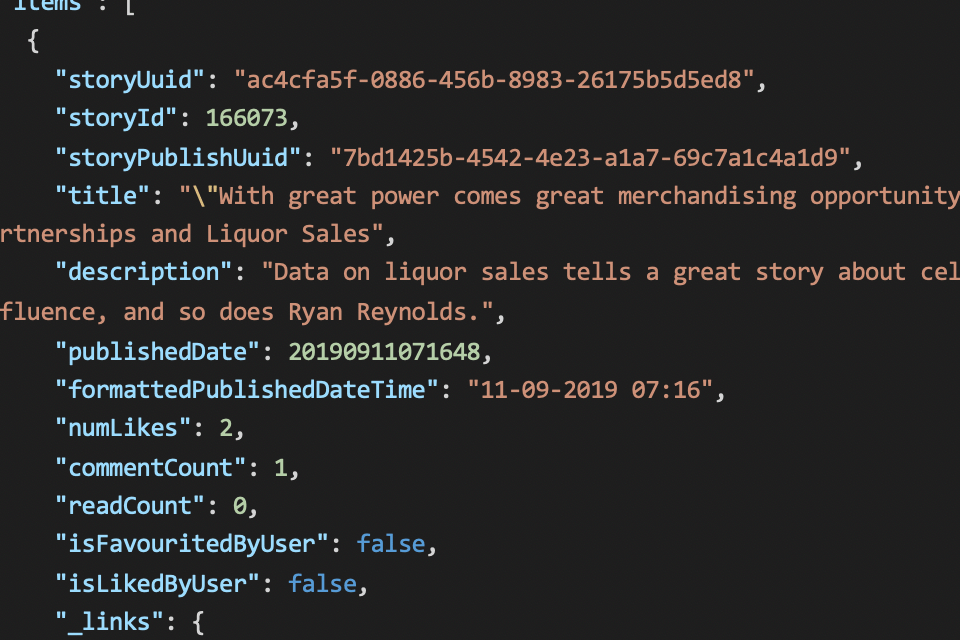
REST API
A new REST API has been introduced to enable developers to fully integrate Signals, Stories, and Collaboration capabilities into any custom front end application.
Font Upload
You can now upload your own corporate fonts into Yellowfin and make it available to your end users.

Present Themes
Design presentation slides upfront and save them as Themes, allowing you and others to leverage templated designs for other presentations or individual slides.
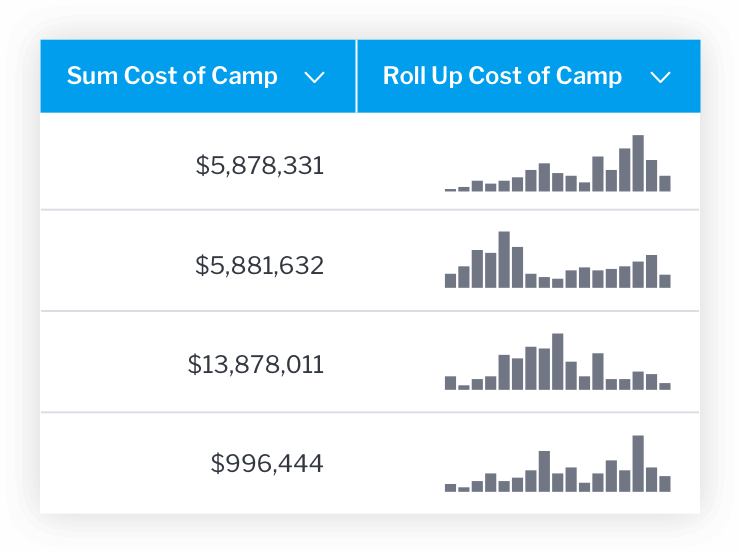
SparkLine Formatter
Create sparklines in a report column that show visual trends in your data.
Learn More About Our Releases


All Releases
Learn more about features in previous Yellowfin releases.


Downloads and
Release Notes
Download the latest Yellowfin release and see the full list of what’s changed.


Yellowfin Wiki
Get started and learn everything Yellowfin has to offer.


Yellowfin Community
Connect with people just like you in our community.

See for yourself
Let us show you the best analytics product on the market with the only analytics platform that combines action based dashboards, automated business monitoring and data storytelling capability.