
Axis Scale in Radar Chart
24 October, 2014
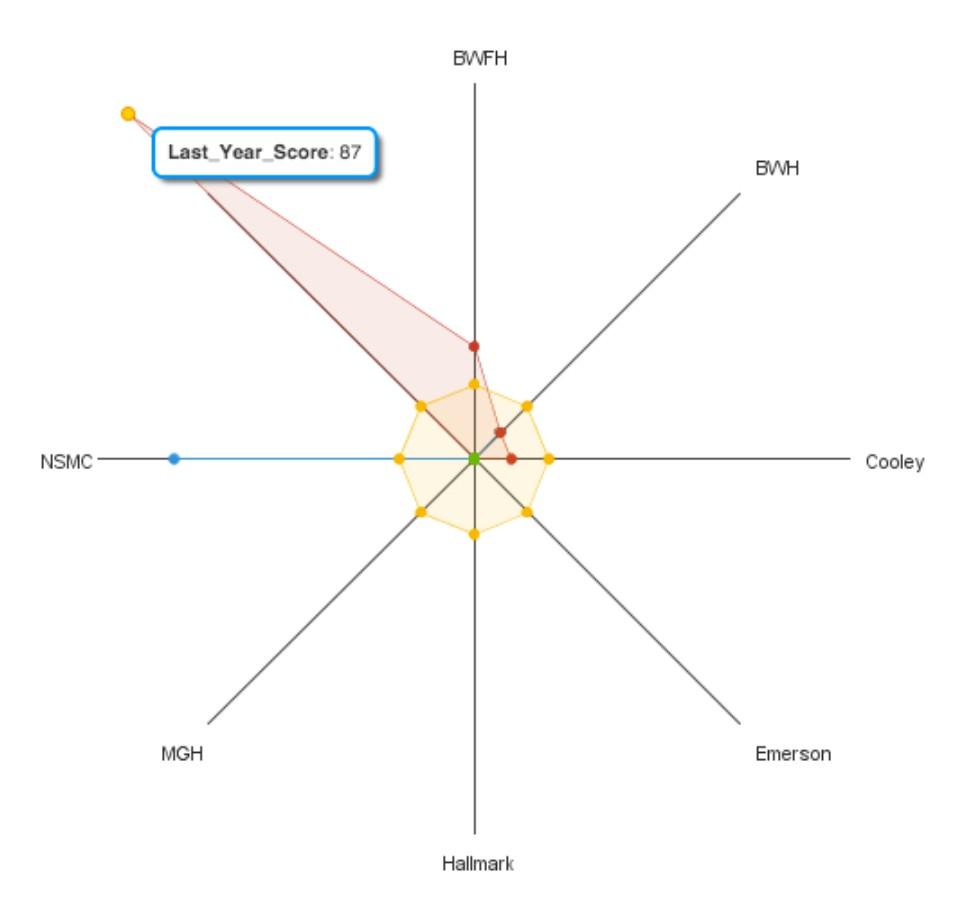
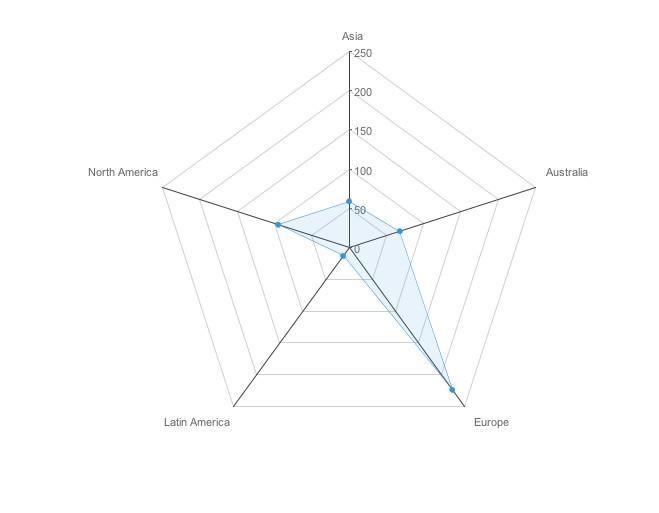
While creating a radar chart, range has been selected as the axis scale, which should create the radar axis from the minimum to maximum value. However, it is doing the reverse. For example, the minimum on our axis should be the Last Year Score of 87.
But, as can be seen below, one of our threshold values of 98 is below the 87 and the values of 100 are the origin of the chart.
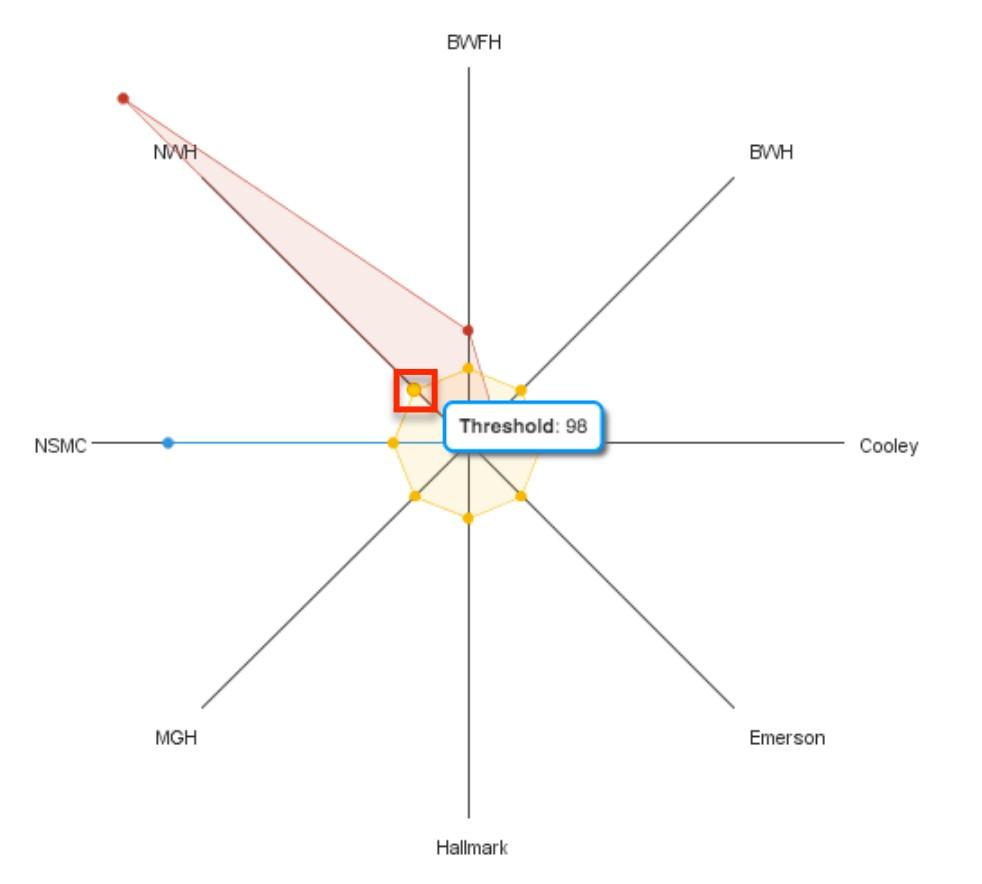
Is there a way to reverse this and have the minimum value of the radar chart as the origin rather than the maximum value?
Thank you,
Asif
But, as can be seen below, one of our threshold values of 98 is below the 87 and the values of 100 are the origin of the chart.
Is there a way to reverse this and have the minimum value of the radar chart as the origin rather than the maximum value?
Thank you,
Asif
Hi Asif,
Thank you for contacting us and for sending through the screenshots. I have just been doing some testing and I believe there is a bug when using RANGE, as it was not selecting the minimum and maximum, as it should. I have raised this as a product defect to be fixed (Task ID: 176807).
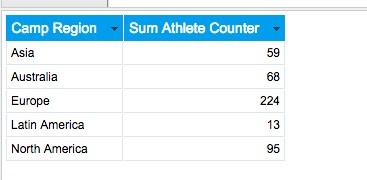
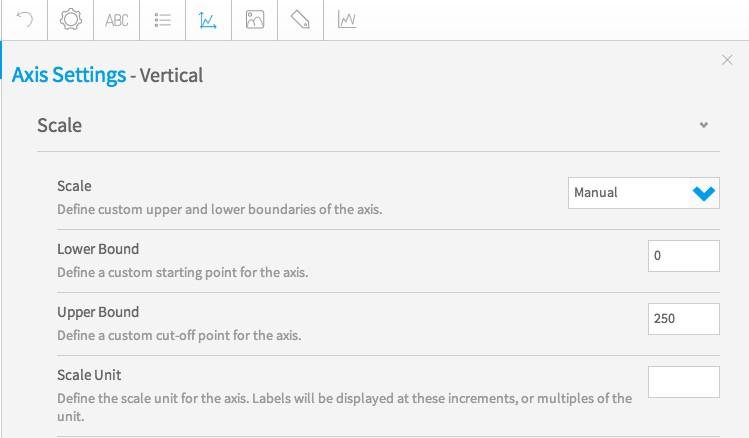
To work around this I selected MANUAL and set my Lower and Upper Bound to reflect the data in my table.

I hope this provides you with the solution you need.
Just so I can add details to the support task, can I ask what build and version of Yellowfin you are using?
If you have any questions or need further assistance with this, please let me know.
Kind Regards,
Katie
Thank you for contacting us and for sending through the screenshots. I have just been doing some testing and I believe there is a bug when using RANGE, as it was not selecting the minimum and maximum, as it should. I have raised this as a product defect to be fixed (Task ID: 176807).
To work around this I selected MANUAL and set my Lower and Upper Bound to reflect the data in my table.
I hope this provides you with the solution you need.
Just so I can add details to the support task, can I ask what build and version of Yellowfin you are using?
If you have any questions or need further assistance with this, please let me know.
Kind Regards,
Katie