
Calculated total for percentage variation in month comparison reports
4 February, 2015
Dear support,
I've built a report to compare two months data: I'm using 2 sub-queries, one for each month, and then comparing them in the main report.
I need a field to calculate the customer variation between the months:I can manage to calculate the % difference for the dimension "Segment Group", but I can't get the total eprcentage, as the "Calculated Totals" is not working.
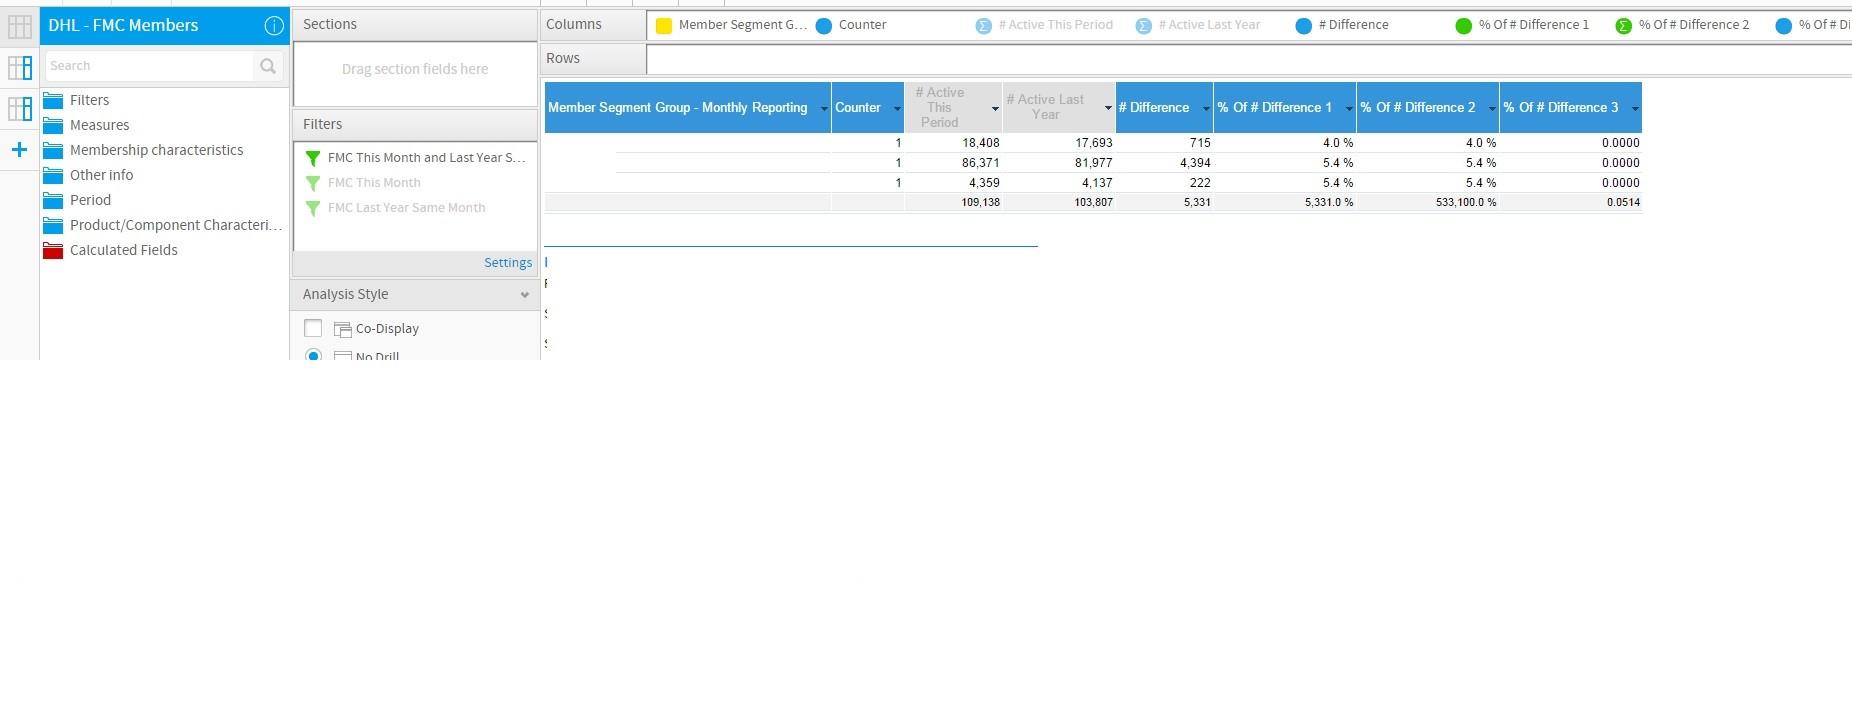
Here the report:
I've tried to calculate the percentage in several different ways, but I can get only the right percentage for each line, or the right total, but not both!
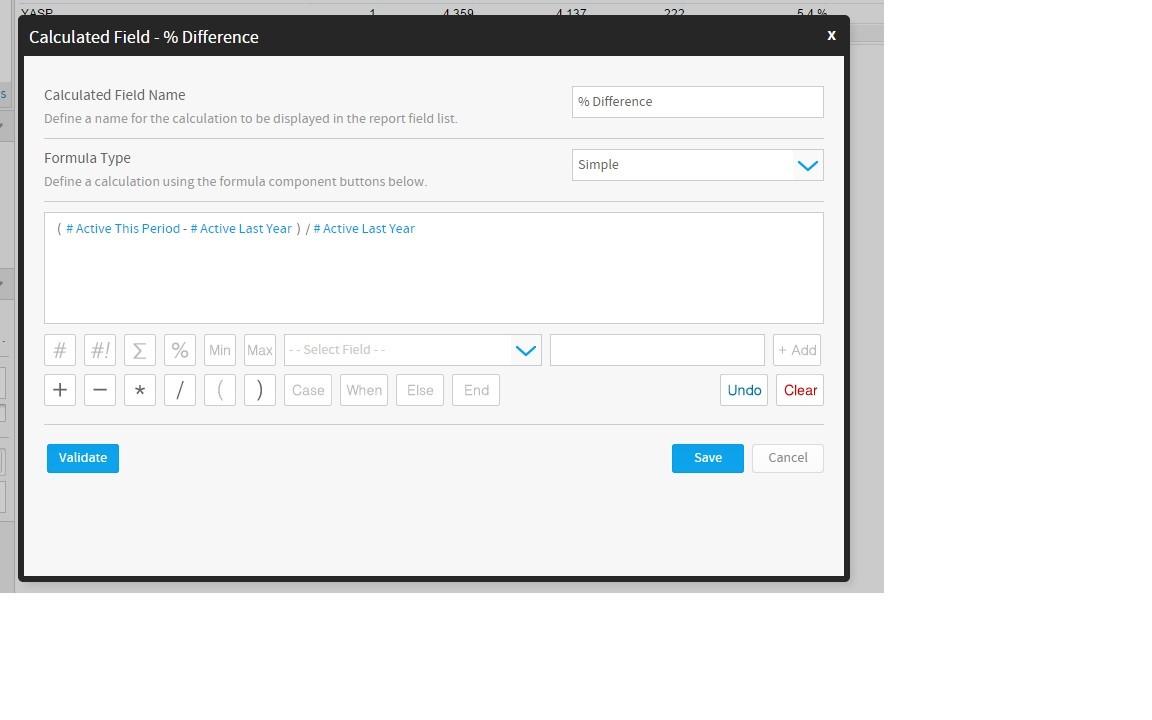
I have 3 calculated fields:
- % of Difference 1: calculation is right on each dimension line (4.0%, 5.4%, 5.4%), but the calculated total is wrong! Here the details: I calculate the difference, and then show the result af a Percentage of the column "active Last Year"
- % of Difference 2: calculation is right on each dimension line (4.0%, 5.4%, 5.4%), but the calculated total is wrong! Here the details: I calculate the difference and multiply it for 100, and then show the result af a DIvision of the column "active Last Year"
- % of Difference 3: calculation is right on the total, but wrong on each dimension line! Here the details: I calculate the difference and multiply it for 100, and then show the result af a DIvision of the column "active Last Year"
Do you have any suggestion on how to build the Calculated field to get the right result for each dimension row and for the total?
Thanks,
Francesca
I've built a report to compare two months data: I'm using 2 sub-queries, one for each month, and then comparing them in the main report.
I need a field to calculate the customer variation between the months:I can manage to calculate the % difference for the dimension "Segment Group", but I can't get the total eprcentage, as the "Calculated Totals" is not working.
Here the report:
I've tried to calculate the percentage in several different ways, but I can get only the right percentage for each line, or the right total, but not both!
I have 3 calculated fields:
- % of Difference 1: calculation is right on each dimension line (4.0%, 5.4%, 5.4%), but the calculated total is wrong! Here the details: I calculate the difference, and then show the result af a Percentage of the column "active Last Year"
- % of Difference 2: calculation is right on each dimension line (4.0%, 5.4%, 5.4%), but the calculated total is wrong! Here the details: I calculate the difference and multiply it for 100, and then show the result af a DIvision of the column "active Last Year"
- % of Difference 3: calculation is right on the total, but wrong on each dimension line! Here the details: I calculate the difference and multiply it for 100, and then show the result af a DIvision of the column "active Last Year"
Do you have any suggestion on how to build the Calculated field to get the right result for each dimension row and for the total?
Thanks,
Francesca
Sorry here the report:

Cheers
Francesca
Cheers
Francesca
Hi Francesca,
sorry for the delay! If you'd like to add more than one inline image to a forum post then please don't forget to click the Add another image button after you've Browsed for your 1st image for the inline attachment:
So, if you wouldn't mine, could you please try again to add in all of the screenshots you had prepared for this post and then we can look into the problem.
regards,
Dave
sorry for the delay! If you'd like to add more than one inline image to a forum post then please don't forget to click the Add another image button after you've Browsed for your 1st image for the inline attachment:
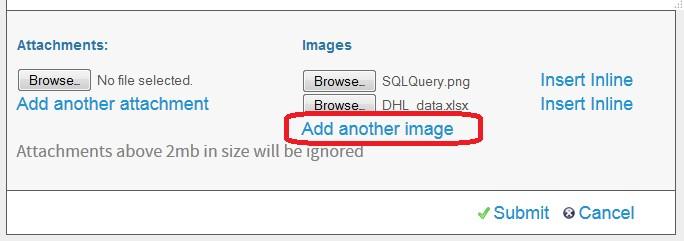
So, if you wouldn't mine, could you please try again to add in all of the screenshots you had prepared for this post and then we can look into the problem.
regards,
Dave
any response to this question? I am trying to build a monthly sales growth report across several departments. I can get the report to work just find as a cross tab but can not figure out how to get a percent change in sales from month to month.
Scott
Scott