
Chart formatter not workink
7 January, 2016
Hi,
in a report I'm building, when I create a chart, the color, size of line etc. does not change from default ( when the configuration of the chart does shows change).
It happened more than once.
Attached is the log part of the error.
Thanks In Advance,
Tal
in a report I'm building, when I create a chart, the color, size of line etc. does not change from default ( when the configuration of the chart does shows change).
It happened more than once.
Attached is the log part of the error.
Thanks In Advance,
Tal
Hi Tal,
I'm wondering if you can provide a few screenshots to document what you are experiencing? The chart itself and
the chart settings, etc.
Unfortunately, the logs aren't telling us a lot about why this is happening.
Further to this, are you able to tell us which version and build you are using?
Thank you,
Kyle
Hi Kyle,
Thanks you for your response.
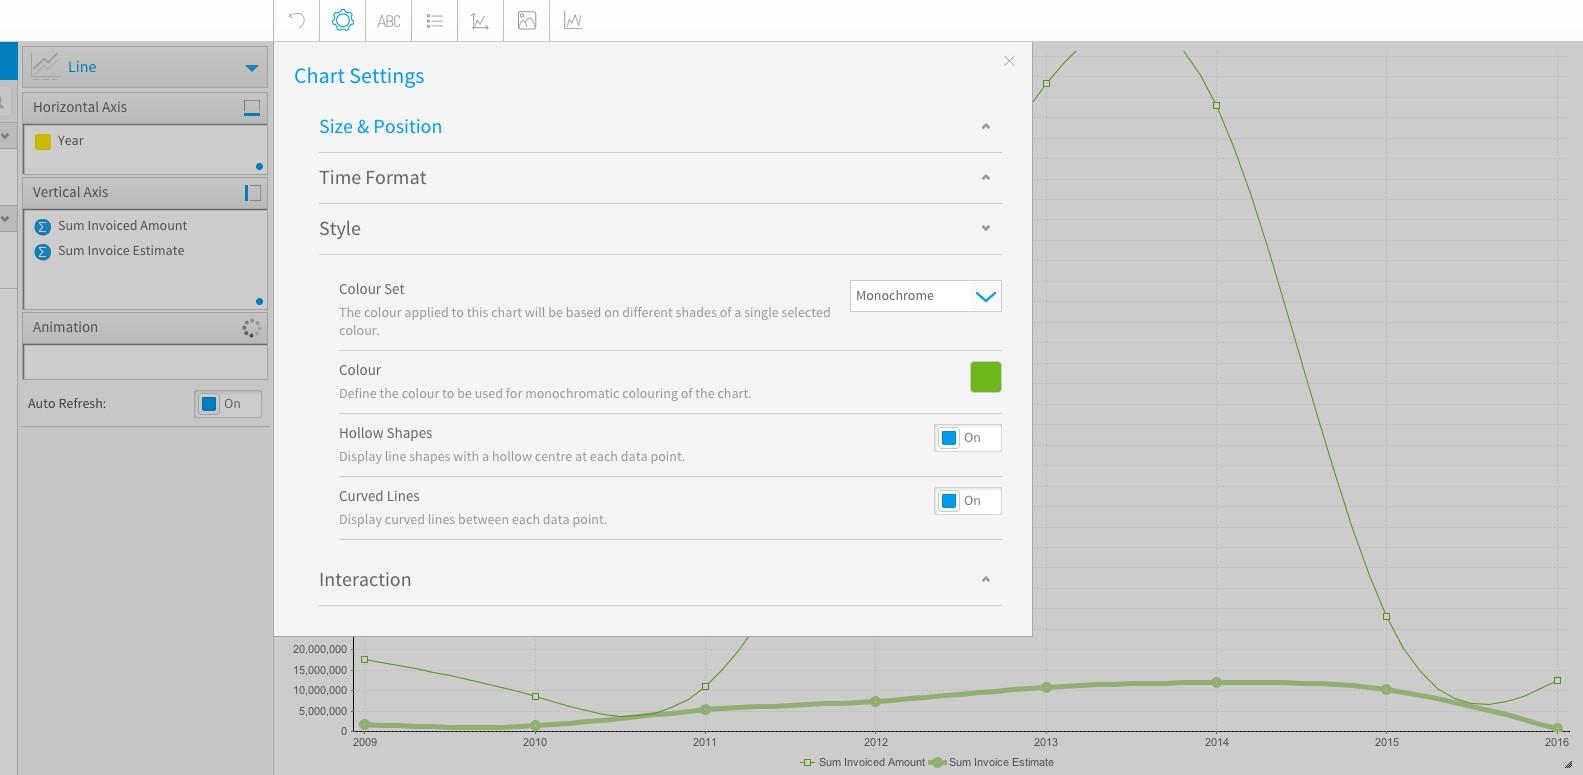
The issue I am experiencing is on the combination chart.
First attached picture shows the chart-

Second & third pictures show the format definitions I'm trying to show in the chart-
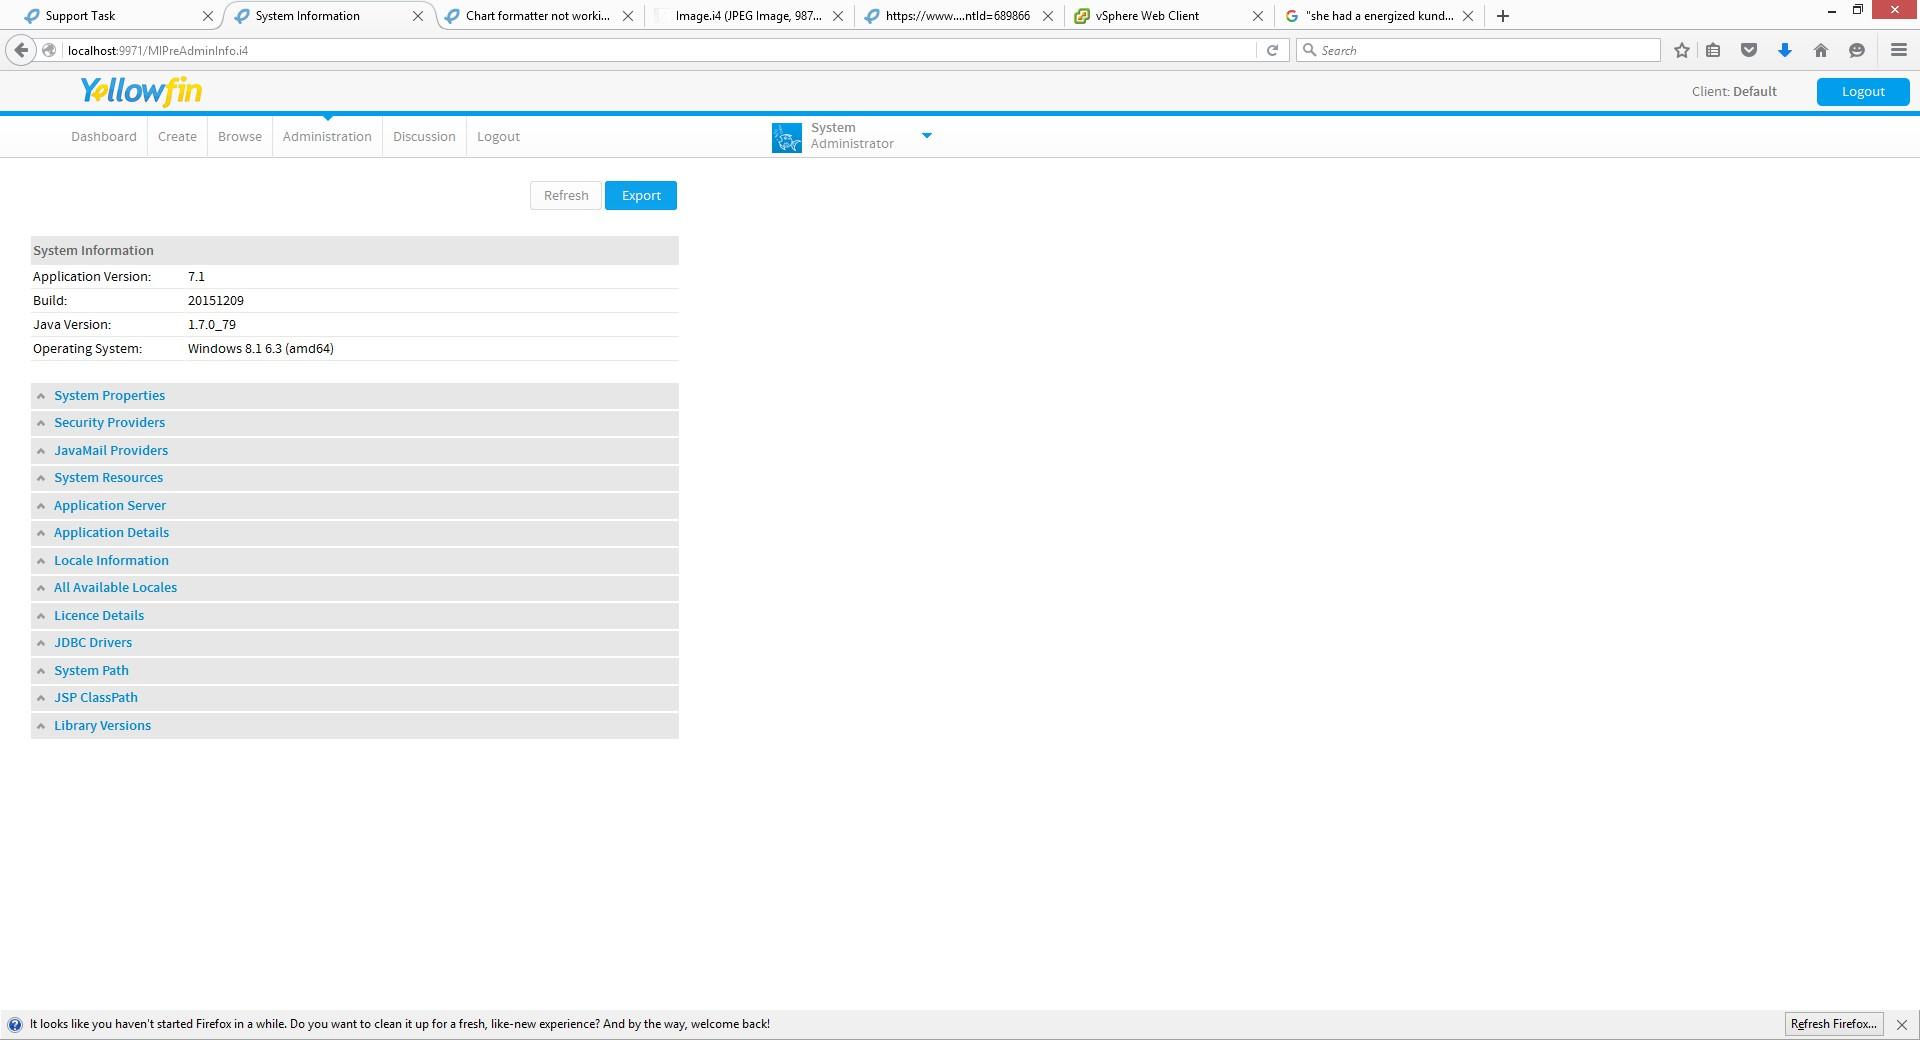
Our build is-20151125
version- 7.1
Thanks!
Tal
Thanks you for your response.
The issue I am experiencing is on the combination chart.
First attached picture shows the chart-

Second & third pictures show the format definitions I'm trying to show in the chart-


Our build is-20151125
version- 7.1
Thanks!
Tal
Hi Tal,
I just tested this on the 7.1, December build and I was able to make the changes to the formatting and it all worked as expected.
You said that you were using the a combination chart but from your screenshots it doesn't look like this is the case because the combination chart icon isn't showing up for you. The only way I was able to create a replica of your chart was to select the Line Chart option and drag in two fields for the vertical axis.
Can you double check this for me and provide a screenshot to show which chart you have selected?
Thank you,
Kyle
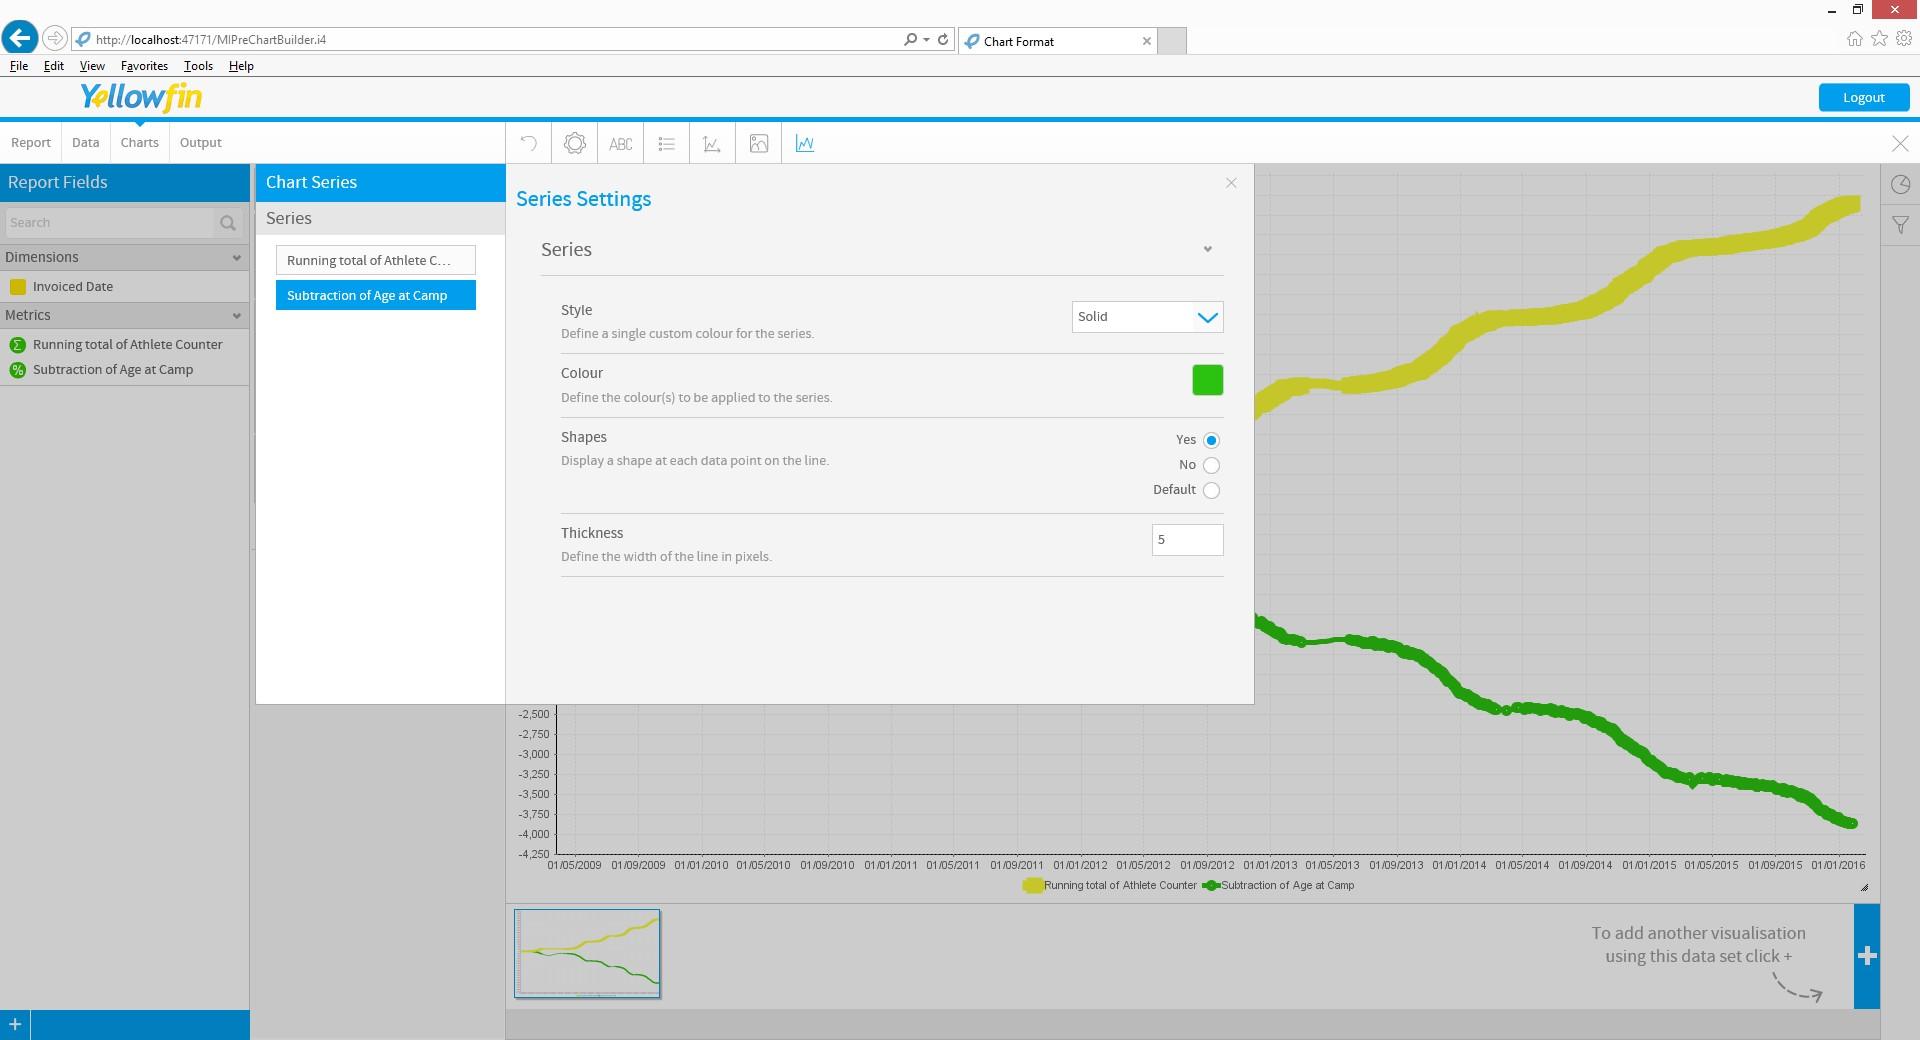
Hi Kyle,
thanks for your answer-
So I double checked and you are right!
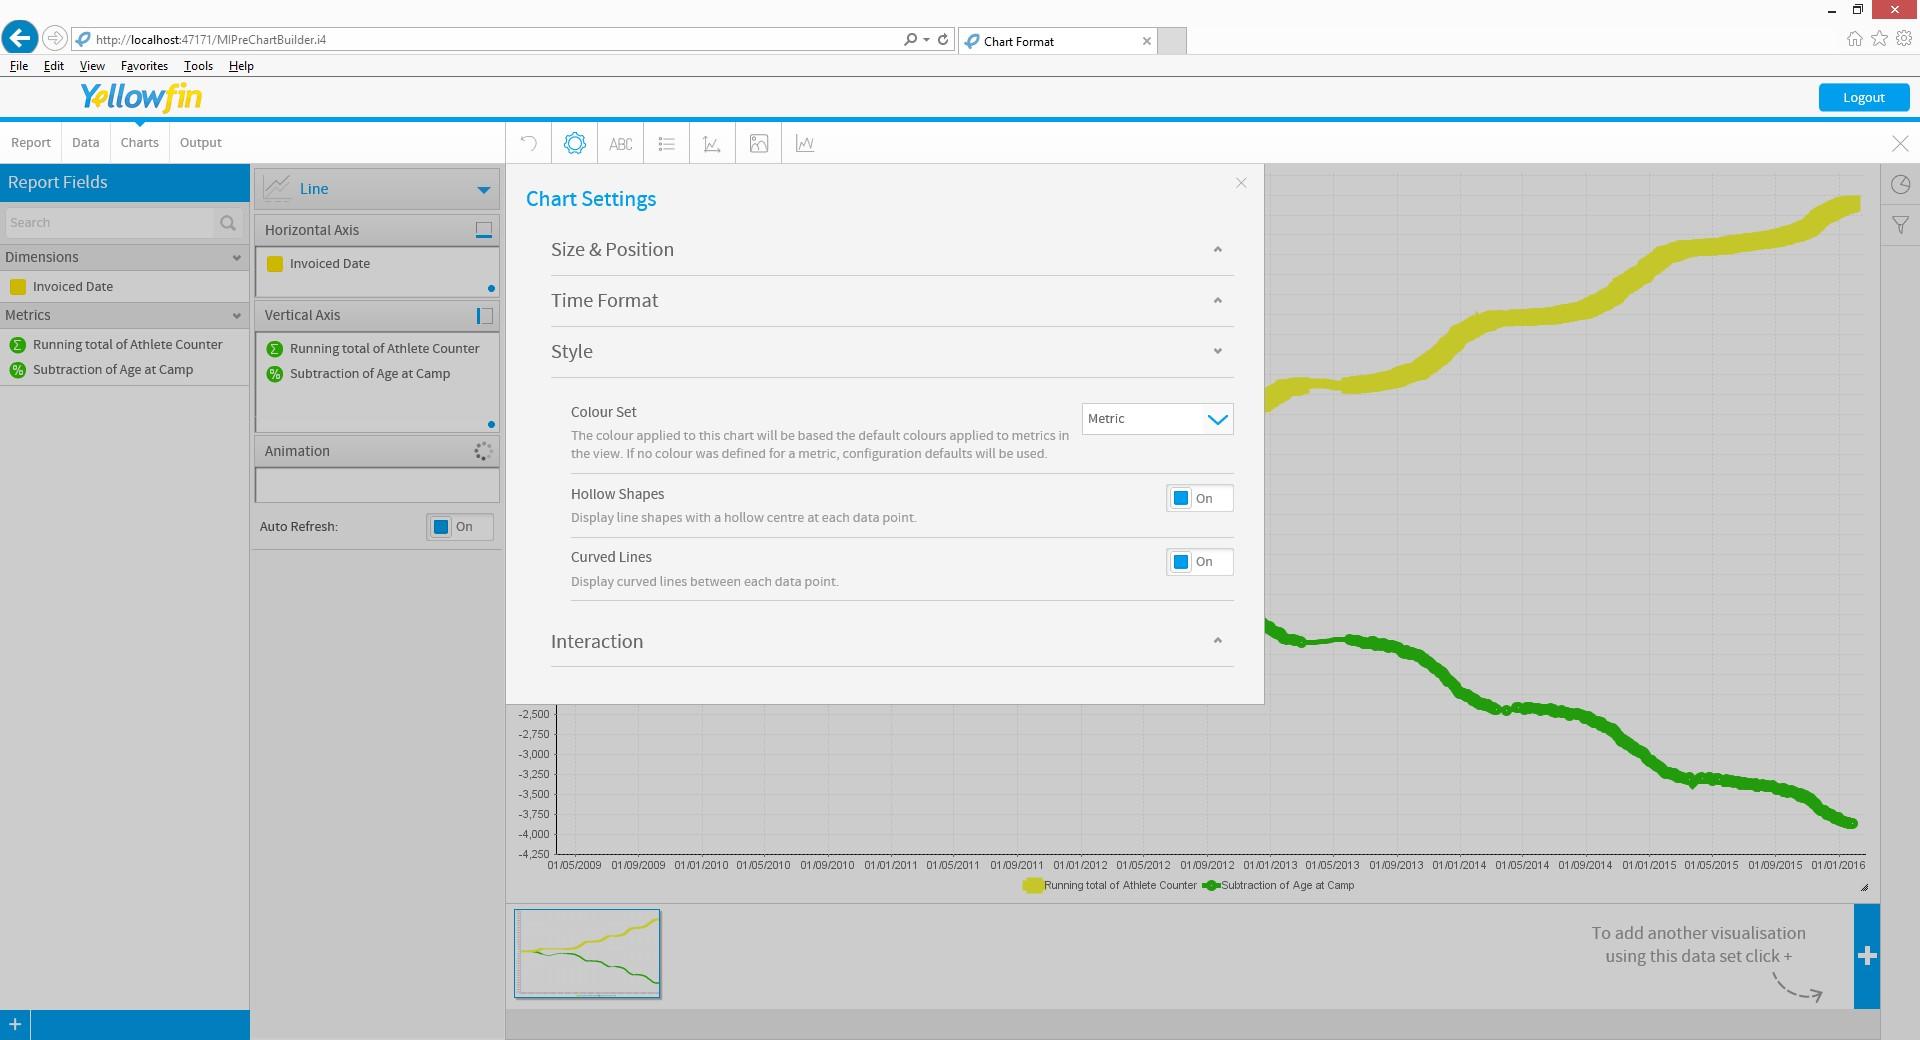
The chart I'm trying to use is a Line chart.
attached are 3 screenshots-
1. type of chart-
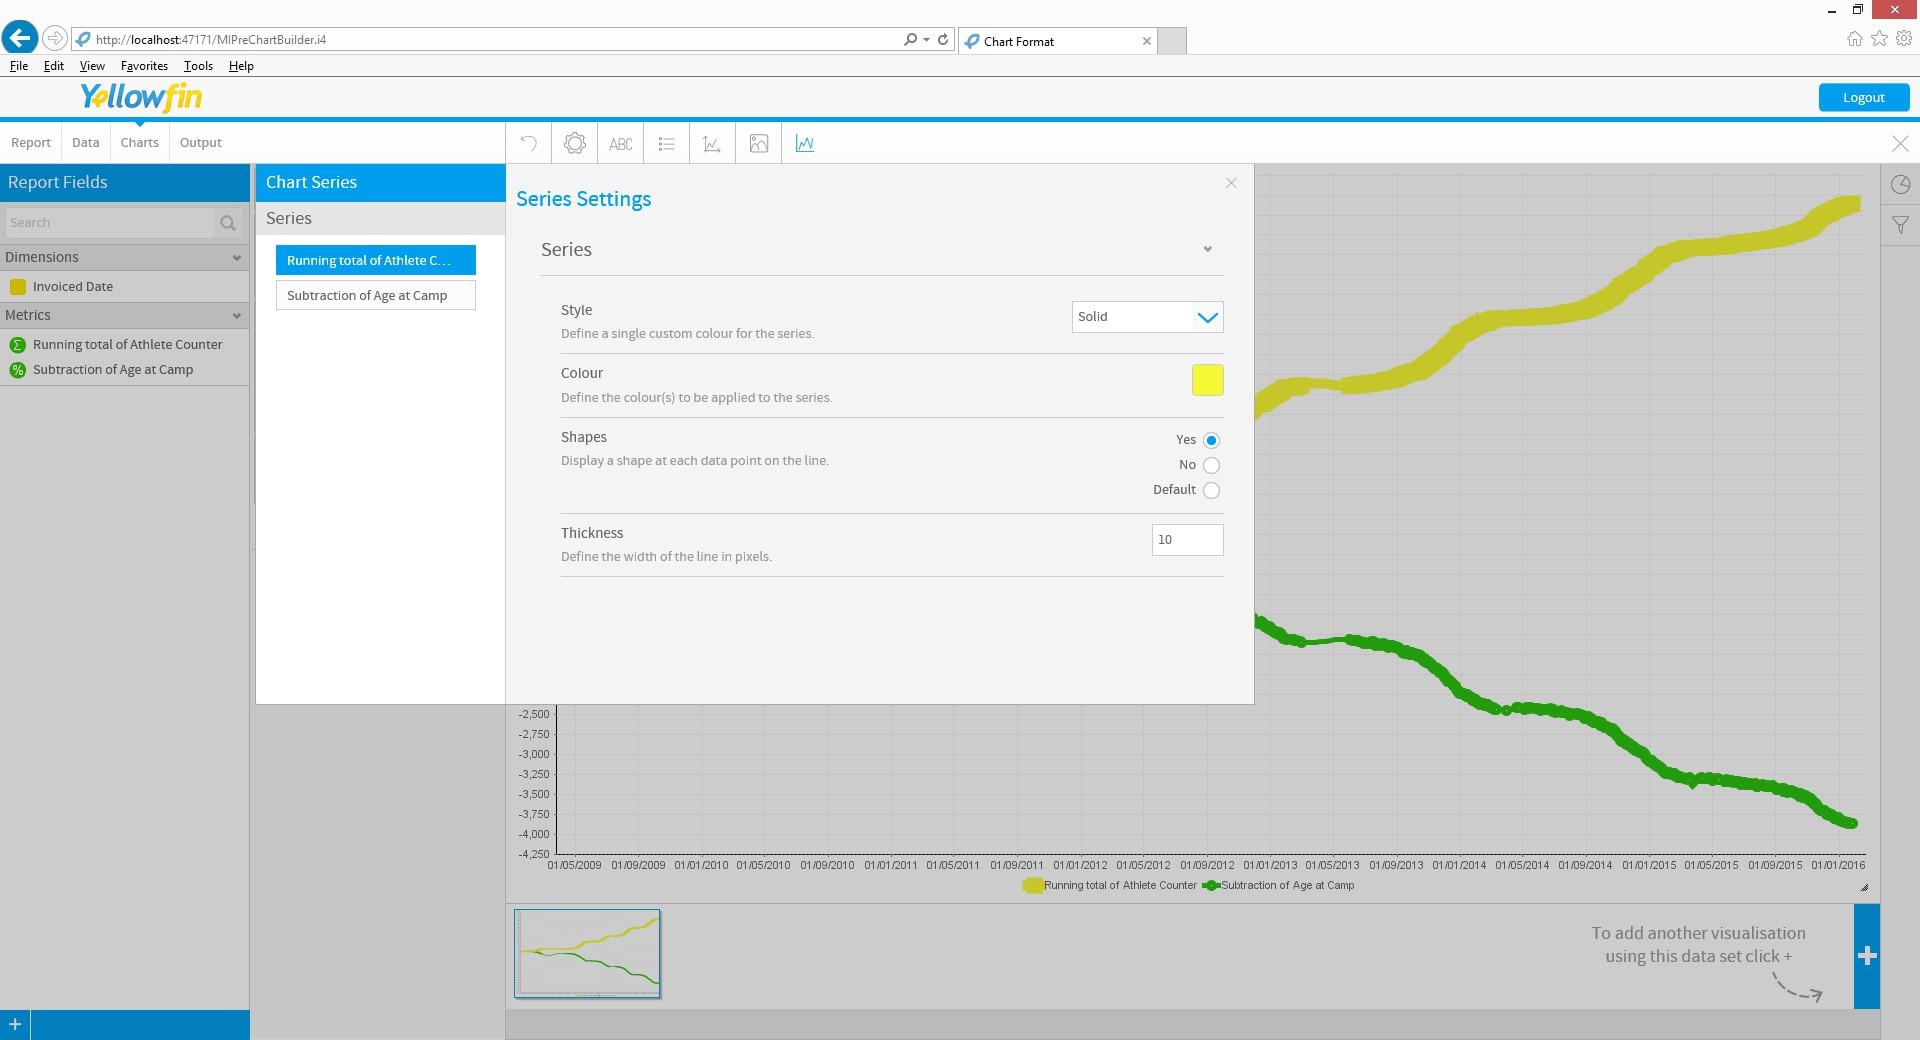
2. the color definition that does not work-
Thanks,
Tal
thanks for your answer-
So I double checked and you are right!
The chart I'm trying to use is a Line chart.
attached are 3 screenshots-
1. type of chart-

2. the color definition that does not work-

Thanks,
Tal
Hi Tal,
I've had a go at this and unfortunately, just like Kyle before me, I can't reproduce the issue. An interesting point about your build 20151125 is that this wasn't an official build which means that it was an interim build in which case interim builds can be buggy, so upgrade to the latest official build).
Then I used a Line Chart with 2 series, I followed the settings from your screenshots, making sure to use an Advanced Function for the 2 series (this is evident from the green colour of them in the "Vertical Axis" text-area)
If you can think of anything special about your reports/view that I should know about please tell me. And also don't forget to upgrade from that interim build and let me know if it helps.
regards,
David