
Chart To Show Column Total
27 March, 2015
Hi YellowFin
I have a column chart
Say 10 Columns
I would like to show the totals for each column
Either
Above the column
Or
In the column
I am using 7.1
I remember doing this several years ago
But cannot figure out how to do it now
Thanks - Grant
I have a column chart
Say 10 Columns
I would like to show the totals for each column
Either
Above the column
Or
In the column
I am using 7.1
I remember doing this several years ago
But cannot figure out how to do it now
Thanks - Grant
Hello Grant,
Have you been able to review our Wiki page that details Column formatting?
Column Formatting
If not, this should help you out. If so, please provide some screenshots of exactly what you
are trying to accomplish and also include the version and build of YF you are using.
Thank you,
Kyle
Have you been able to review our Wiki page that details Column formatting?
Column Formatting
If not, this should help you out. If so, please provide some screenshots of exactly what you
are trying to accomplish and also include the version and build of YF you are using.
Thank you,
Kyle
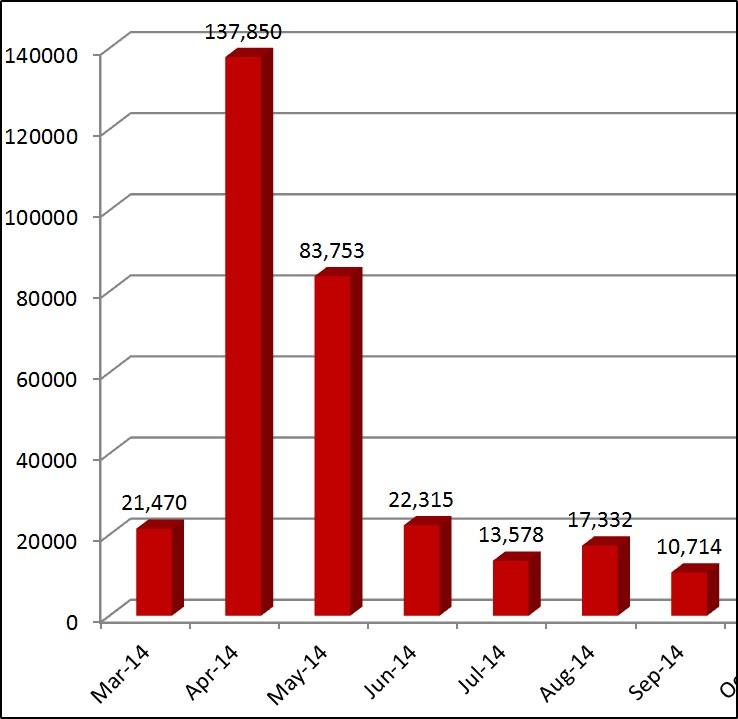
Hi Kyle,
Example Image - Show Chart Column Total

Example Image - Show Chart Column Total
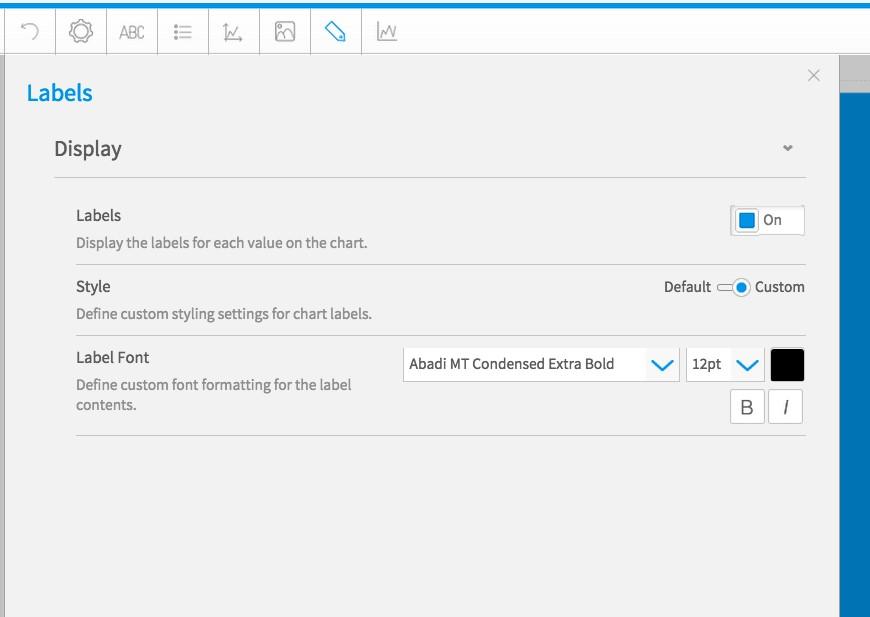
Hi Grant,
In the Chart Builder go here and turn Labels on -
Your Chart should render like this -
Here is also a link to Wiki on Labels in Charts.
Chart Labels
Thank you for clarifying and I hope this helps.
Kyle
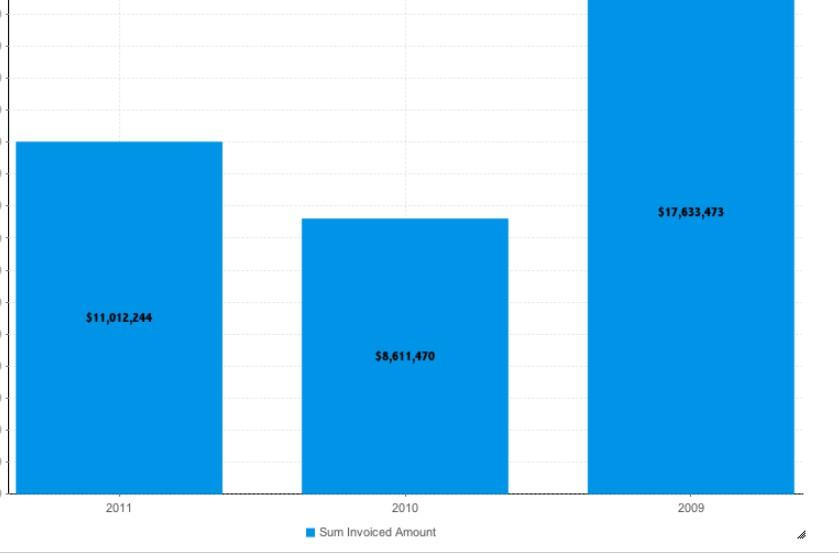
In the Chart Builder go here and turn Labels on -
Your Chart should render like this -
Here is also a link to Wiki on Labels in Charts.
Chart Labels
Thank you for clarifying and I hope this helps.
Kyle
Hi Kyle,
Yes it worked - Thanks For That
Seems though no option to show totals at the top of the column
Only option is totals inside in each column
Thanks For Your Help - Grant
Yes it worked - Thanks For That
Seems though no option to show totals at the top of the column
Only option is totals inside in each column
Thanks For Your Help - Grant
hi
i have three types of products (cold, warm, hot) how can show these product types total like cold 5, warm 3 and hot 6 on dashboard chart?
i have three types of products (cold, warm, hot) how can show these product types total like cold 5, warm 3 and hot 6 on dashboard chart?
Hello,
Can you provide more specifics in what you are after? We are not sure what you
mean by 'dashboard chart'? Are you just trying to total your columns and then show
them in a bar chart? Please provide more information and we will attempt to assist
you.
Thank you,
Kyle
Can you provide more specifics in what you are after? We are not sure what you
mean by 'dashboard chart'? Are you just trying to total your columns and then show
them in a bar chart? Please provide more information and we will attempt to assist
you.
Thank you,
Kyle