
Charts versus Tables
30 January, 2014
In the new version (7) where is the report details option (where you set whether to have a table, a chart or both)?
Is it in the Data section when you are editing a report?
Is it in the Data section when you are editing a report?
Hi Allan
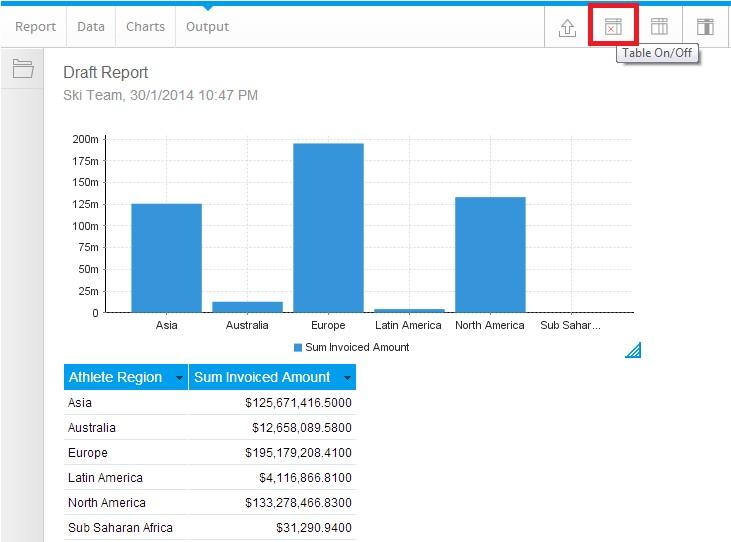
By Default (or if no Chart is defined) you will only have a Table,
If a Chart is defined you will have a Table and Chart.
Here's how to enable/disable the Table in the Output Screen (if a chart exists)
Please let me know if this is what you are after
Regards,
Stephen
By Default (or if no Chart is defined) you will only have a Table,
If a Chart is defined you will have a Table and Chart.
Here's how to enable/disable the Table in the Output Screen (if a chart exists)
Please let me know if this is what you are after
Regards,
Stephen
Thanks for your reply. This is how I expected it to work, however in our case there is no chart defined, but the report "defaults" to a blank chart on the dashboard, with the table only being visible by clicking on the table symbol at the top right of the chart/table frame.
A bit of history (if it makes a difference). This report was likely built in version 6.3 and then converted to version 7. The report was working fine (default to table, since no chart was defined) until it was edited; the saved and activated report then exhibited the behaviour described.
At the very least, is there a switch in the definition for the report in the database that I can force to be off?
Thanks,
Allan
Hi Allan,
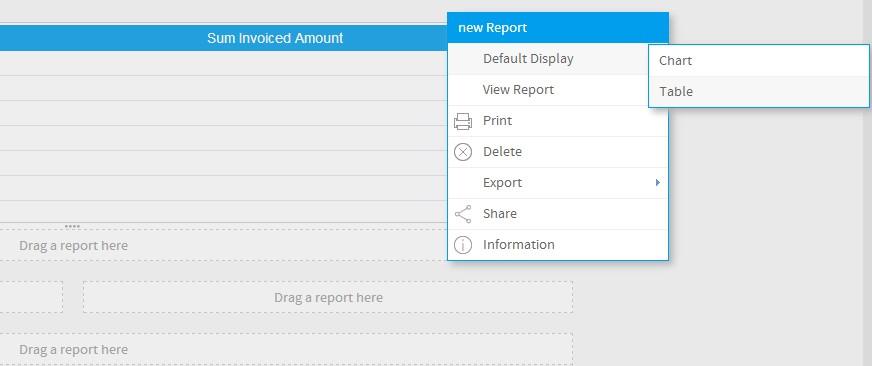
This is a bug in YF 7, when the Chart menu is clicked the Table and Chart option is selected and cannot be change via the GUI.
As a work around when adding your Report to the dashboard, you can set the default display to Table as follows.

(NB The latest YF update build 20140131 has the fix included)
Sorry for the inconvenience caused
Regards,
Stephen
This is a bug in YF 7, when the Chart menu is clicked the Table and Chart option is selected and cannot be change via the GUI.
As a work around when adding your Report to the dashboard, you can set the default display to Table as follows.
(NB The latest YF update build 20140131 has the fix included)
Sorry for the inconvenience caused
Regards,
Stephen