
Clustered Bar chart with 6 metrics and one dimension
8 July, 2015
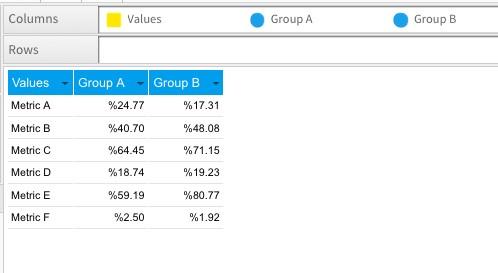
Hi I have a data set that looks like this:
Values Group A Group B
Metric A 24.77% 17.31%
Metric B 40.70% 48.08%
Metric C 64.45% 71.15%
Metric D 18.74% 19.23%
Metric E 59.19% 80.77%
Metric F 2.50% 1.92%
I want to do a clustered bar chart but I have only one dimension (what I call group).
How do I do that with your tool. It seems to want a minimum of 2 dimensions. I've attached the data example from excel to show what I want.
Hi There,
May I ask what version of Yellowfin you are using? To check the build of Yellowfin you are using go to System Information under Administration > Admin Console > System Information. The version of Yellowfin is listed next to Application Version.
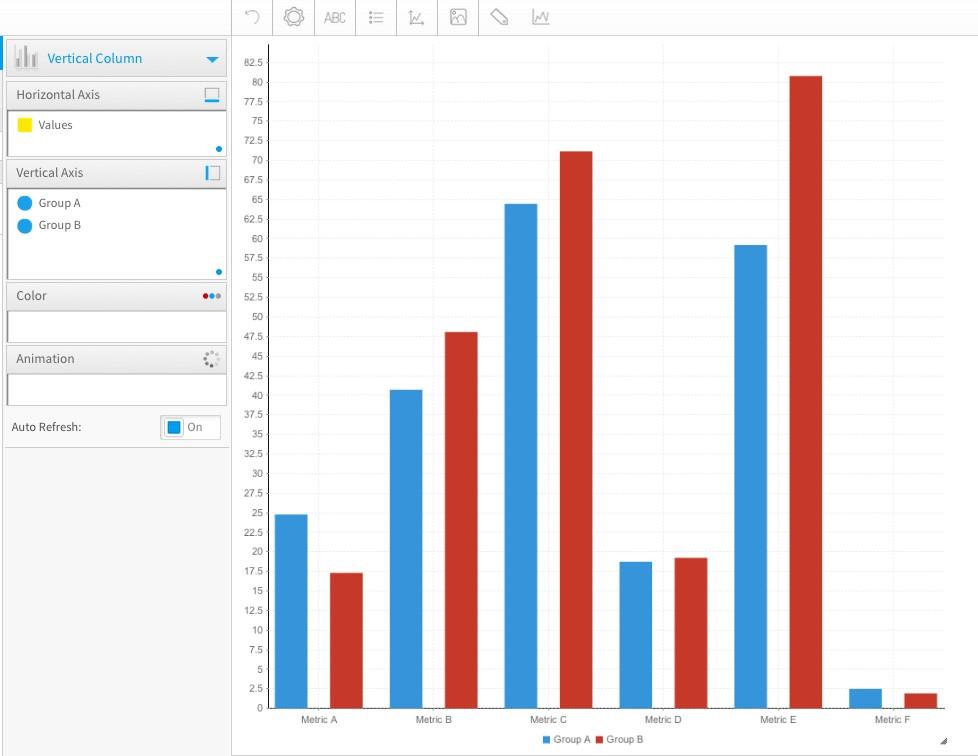
The reason I ask is because I recreated the data in yourexample and was able to produce a chart (Vertical Column) that matches what you have displayed in your PDF as seen below:

Is this what you are trying to produce? If so, you should be able to create this chart with a single dimension. Please let me know if I'm misunderstanding your problem or if this information has been helpful.
I look forward to hearing back. Have a great day!
Cheers,
Dustin
Best regards,
The Yellowfin Support Team
Contact Us:
Email: support@yellowfin.bi
Wiki: wiki.yellowfin.com.au/display/USER71/Home
Community Forum: www.yellowfinbi.com/YFForum.i4
May I ask what version of Yellowfin you are using? To check the build of Yellowfin you are using go to System Information under Administration > Admin Console > System Information. The version of Yellowfin is listed next to Application Version.
The reason I ask is because I recreated the data in yourexample and was able to produce a chart (Vertical Column) that matches what you have displayed in your PDF as seen below:
Is this what you are trying to produce? If so, you should be able to create this chart with a single dimension. Please let me know if I'm misunderstanding your problem or if this information has been helpful.
I look forward to hearing back. Have a great day!
Cheers,
Dustin
Best regards,
The Yellowfin Support Team
Contact Us:
Email: support@yellowfin.bi
Wiki: wiki.yellowfin.com.au/display/USER71/Home
Community Forum: www.yellowfinbi.com/YFForum.i4
Application Version: 7.1
Build: 20150528
Java Version: 1.7.0_80
I had to "fake" a measures dimension using sql but eventually I was able to do this. It was very hard and not intuitive for such a simple report.
I see you have a Values dimension. I don't have that. Group A and Group B are not separate fields, they are values in a single dimension.
Entire Data Set:
Group MeasureA MeasureB MeasureC MeasureD MeasureE
N 52.65 50.61 40.70 60.31 18.74
Y 59.61 46.15 48.07 63.46 19.23
So, I have 6 separate measures - each in separate columns (not in a Values dimension....) and one Dimension called Group. So I don't see how to do what you are showing me in your images.
The work around I did was to write a column to row transformation query so that I have a data set like below but that is a lot of work and could be slow with a large dataset
Group Measure Value
N MeasureA 52.6557712
Y MeasureA 59.61538462
N MeasureB 50.61287028
Y MeasureB 46.15384615
N MeasureC 40.70480082
Y MeasureC 48.07692308
N MeasureD 60.31664964
Y MeasureD 63.46153846
N MeasureE 18.74361593
Y MeasureE 19.23076923