
Co-display chart+table from different reports side by side
22 October, 2014
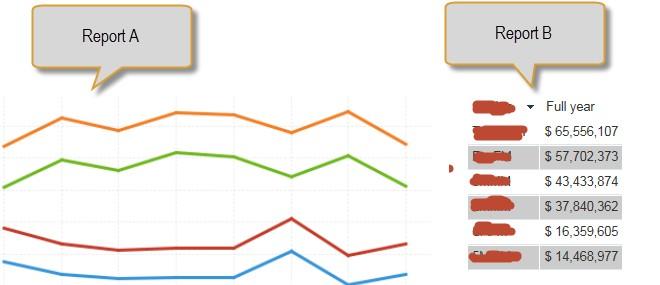
My dashboard requirement is: a chart that displays value by month for 12 months displayed side by side with a table that shows only full year.
Visually I am looking for:
========|=========
chart | table
|
|
========|=========
as per attached picture.
Precisely lined up so that top edge of table lines up with top edge of chart.
I understand from other posts that co-display of two separate reports is needed to achieve the chart+table combination:
a) please confirm two separate reports + co-display needed
b) with co-display how can I achieve desired layout? My current attempt forces chart or table on to next "row" so that one is displayed above the other.
Hi Justin,
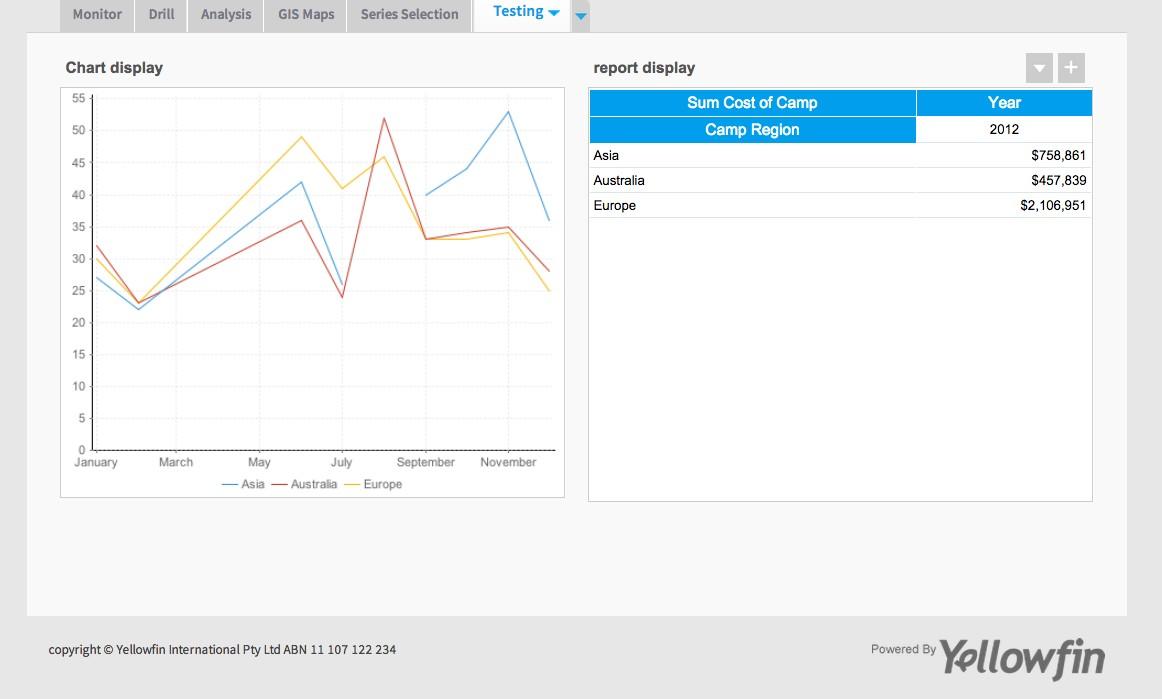
Co-display will allow you to display the chart and table side by side at the report level but in a dashboard it will display the chart or the table, not the two together.
The best way for you to achieve this would be to create two separate reports. One displaying the chart, showing month by month and one displaying you table for the whole year. These can then be placed side by side on your dashboard.
I hope this provides you with the information you need.
If you have any other questions or need further assistance with this, please let me know.
Kind Regards,
Katie
Hi Justin and Katie,
Is there any other way to display Table and Chart from different reports side by side in a Dashboard.??
If yes, Can you guys help me ?
Is there any other way to display Table and Chart from different reports side by side in a Dashboard.??
If yes, Can you guys help me ?
Hi Justin and Katie,
Is there any other way to display Table and Chart from different reports side by side in a Dashboard.??
If yes, Can you guys help me ?
Is there any other way to display Table and Chart from different reports side by side in a Dashboard.??
If yes, Can you guys help me ?