
Conditional formatting for bar charts
6 February, 2014
Hi Team,
I would like to know if we could assign the color for the value of bar charts based on a condition.
Can I have a conditional coloring for a bar where if the value is less that zero, it has to be in red color otherwise it will be green. As of now we are just assigning a column value with a color.
Please let me know if this is possible to be achieved or if you may want any other information.
Thanks & Regards,
Manoj
Hi Manoj,
at the moment it is not possible to have Conditional Formatting applied to Bar Charts, i.e. the colour of a bar cannot be changed at run-time according to what value it is representing. So I have raised an enhancement request for this, the support task ID is 154911.
regards,
Dave
at the moment it is not possible to have Conditional Formatting applied to Bar Charts, i.e. the colour of a bar cannot be changed at run-time according to what value it is representing. So I have raised an enhancement request for this, the support task ID is 154911.
regards,
Dave
Is this still accurate that bar charts can not include conditional formatting? This seems to be a feature that you had way back in 2012
https://www.yellowfinbi.com/YFCommunityNews-Yellowfin-Quick-How-To-Conditional-Formatting-on-Charts-113212
https://www.yellowfinbi.com/YFCommunityNews-Yellowfin-Quick-How-To-Conditional-Formatting-on-Charts-113212
Hi Scott,
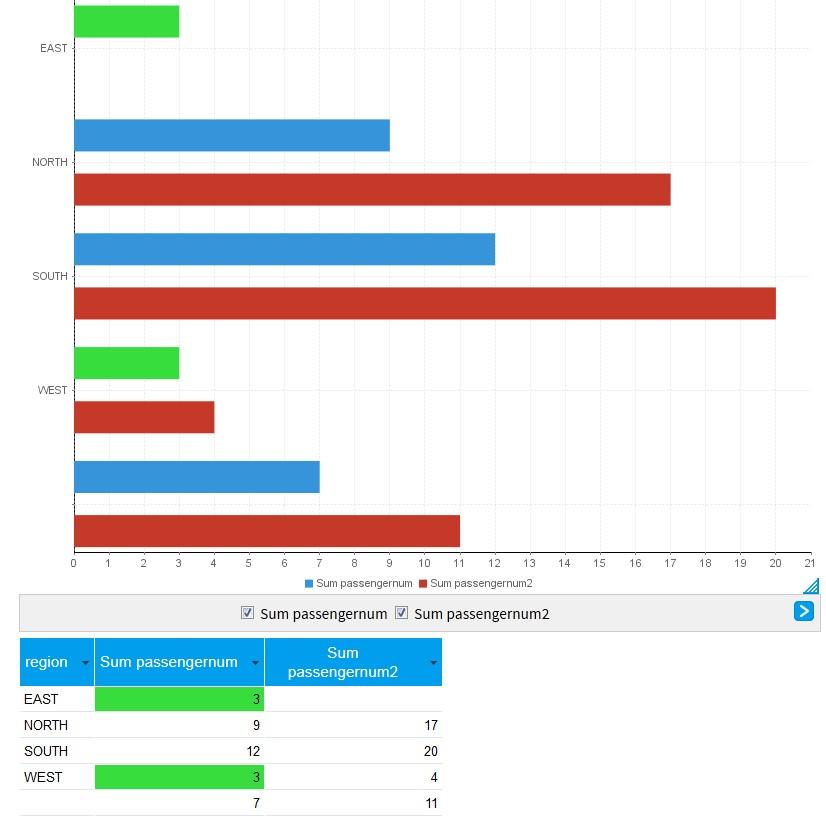
no it is not accurate, and the GUI has changed since then, here are screenshots from the latest version:
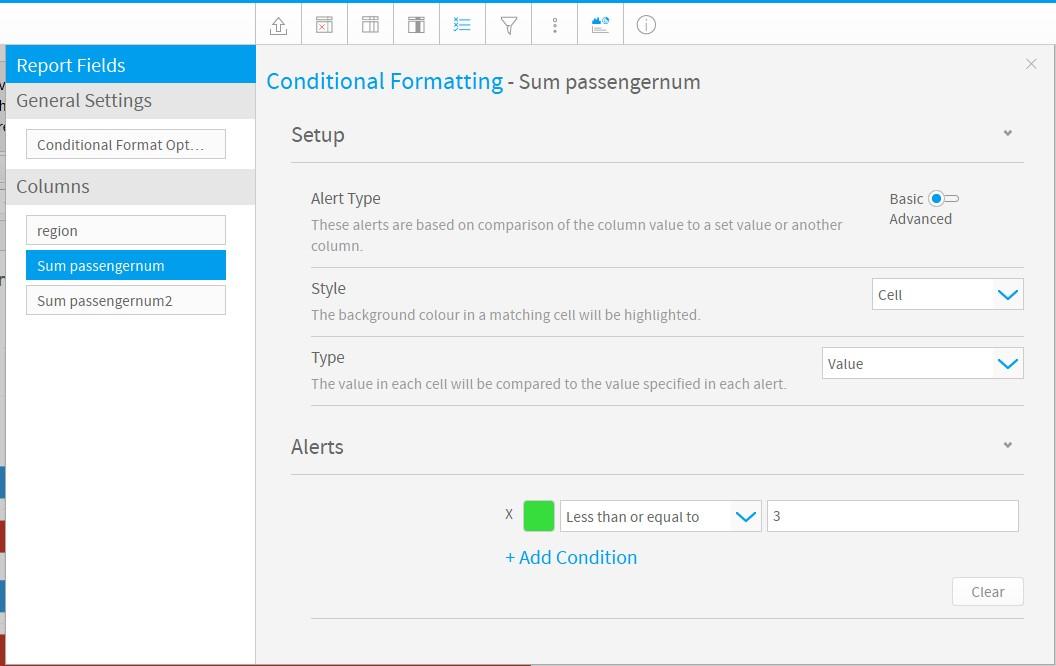
1) create a conditional formatting alert

2) Enable the conditional formatting display in the Series Selection panel
3) Select the display options required for the alert
regards,
Dave
no it is not accurate, and the GUI has changed since then, here are screenshots from the latest version:
1) create a conditional formatting alert
2) Enable the conditional formatting display in the Series Selection panel
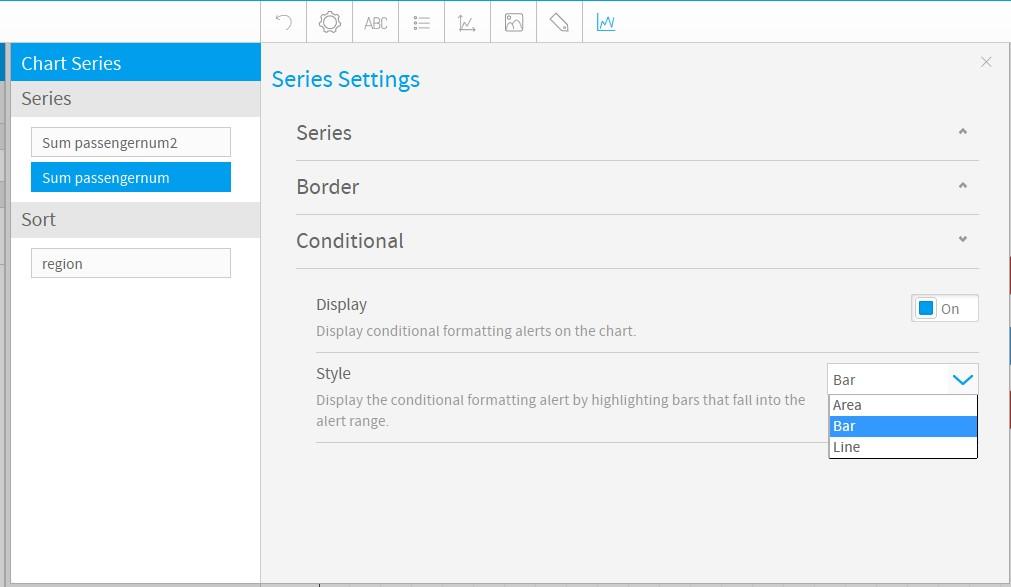
3) Select the display options required for the alert
regards,
Dave
Hi Dave,
Any ideas on how to highlight the MAX value in a bar chart?
I tried a basic conditional format using Percentage of Max = 100%. The cell in the table is highlighted but the condition is not applied to the chart.
I also tried the advanced conditional formatting. I set the condition based on a Rank Ascending column I created and set the condition =1. Yet again cell in table is highlighted but not the bar column.
It only works when I use a basic condition and set the value a fixed number as in the examples shown in the previous posts. e.g Cell Value greater than 100,000. But then the values in the chart will change based on filters applied.
Thanks,
Paul