
Conditional Graph Color
28 April, 2015
Hi! I�d like to know how to set the conditional format color in the Graph based in other column in the same way as we set in the table format. I realized that we can use the Color Min and Max, but it is not the same colors as we have in the table format.
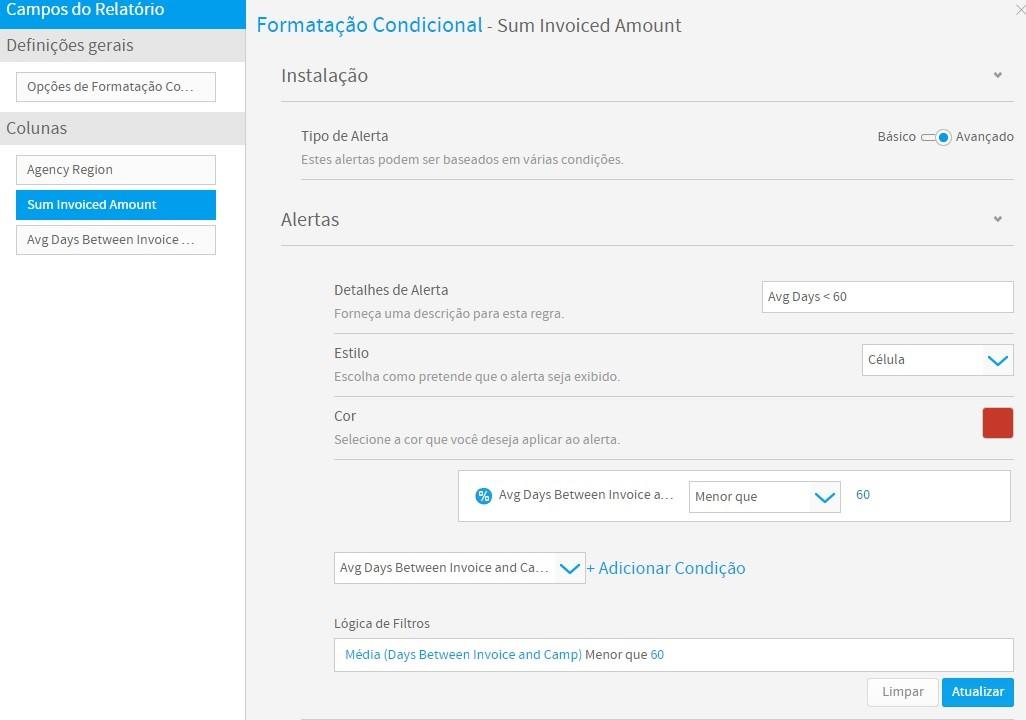
Table conditional format:
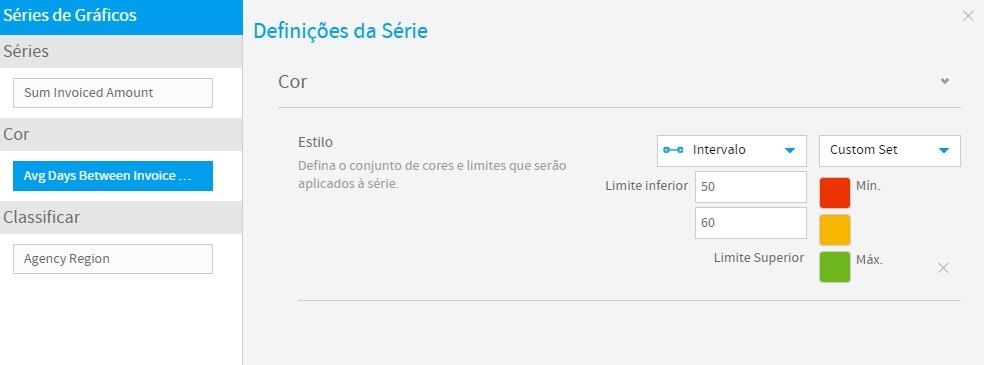
Graph Format:
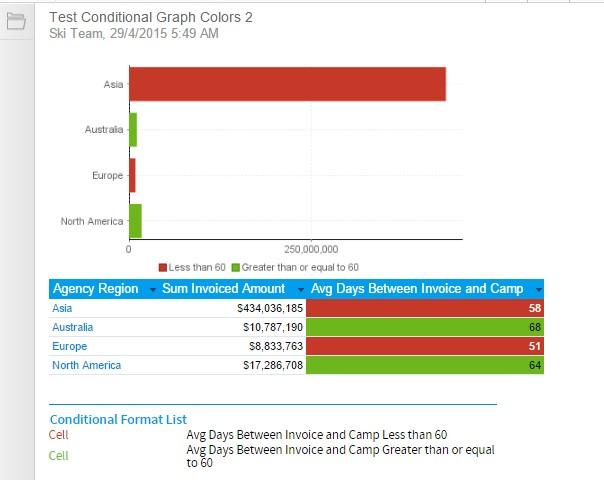
Results:

You can realize that Asia is Green and not Red as in the table. Please, I�d like to have the same colors in the table and the graph. See the XML from Skiteam attached.
Table conditional format:
Graph Format:
Results:
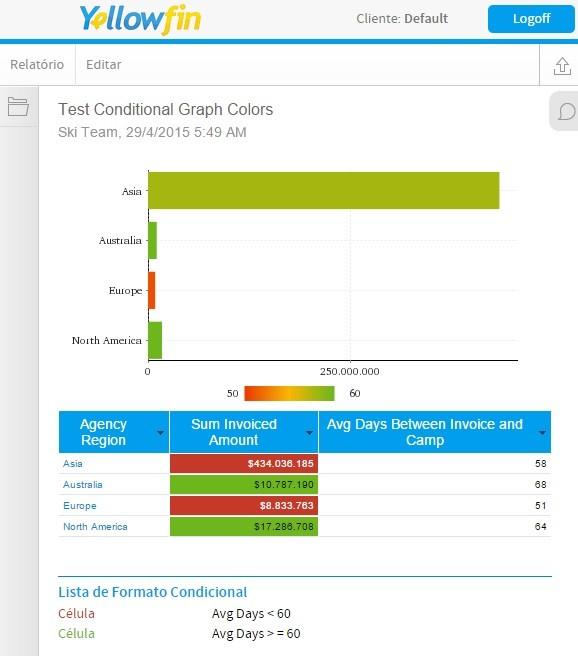
You can realize that Asia is Green and not Red as in the table. Please, I�d like to have the same colors in the table and the graph. See the XML from Skiteam attached.
Hi Arthur,
Sorry for the delayed response.
From what I can tell you have 2 different conditions.
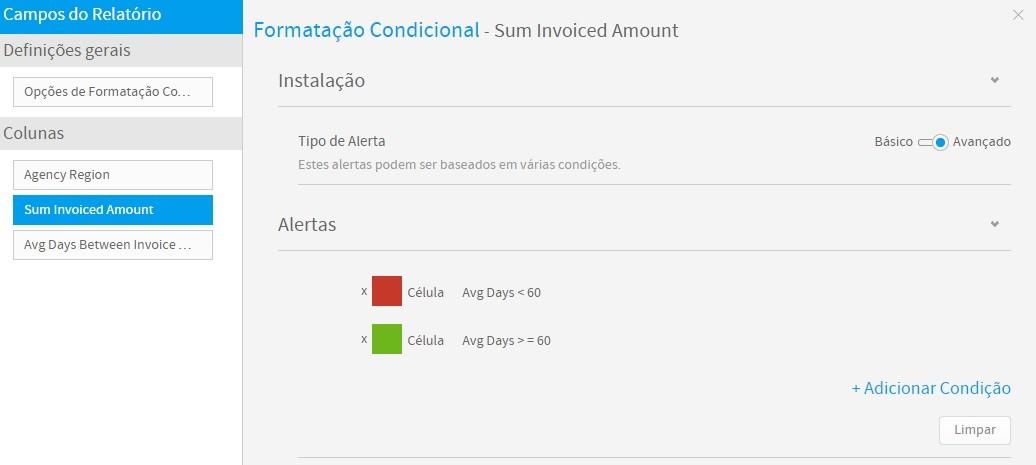
The table says :
"anything below 60 = RED , anything above 60 = GREEN".
So it's either Yes or No. 2 different colors.
But you're then displaying this on the 'Invoiced Amount Column'
Since the chart has the 'AVG Days at camp' as the color field, you cannot use this condition.
The 'range' option you were using, is not a conditional format and works differently, as it's a metric range.
What you want to do is;
1. Create a basic conditional format for the AVG days at camp field
2. On your chart, choose the conditional format as the color.
You will then have this:
I have exported a copy of this report and attached.
Please let me know if this does not give you what you were after.
Regards,
David
Sorry for the delayed response.
From what I can tell you have 2 different conditions.
The table says :
"anything below 60 = RED , anything above 60 = GREEN".
So it's either Yes or No. 2 different colors.
But you're then displaying this on the 'Invoiced Amount Column'
Since the chart has the 'AVG Days at camp' as the color field, you cannot use this condition.
The 'range' option you were using, is not a conditional format and works differently, as it's a metric range.
What you want to do is;
1. Create a basic conditional format for the AVG days at camp field
2. On your chart, choose the conditional format as the color.
You will then have this:
I have exported a copy of this report and attached.
Please let me know if this does not give you what you were after.
Regards,
David