
Crosstab totals and Percents
28 August, 2015
Hello,
I am creating a report that shows revenue per client for several departments over several years. An excel sample is here:
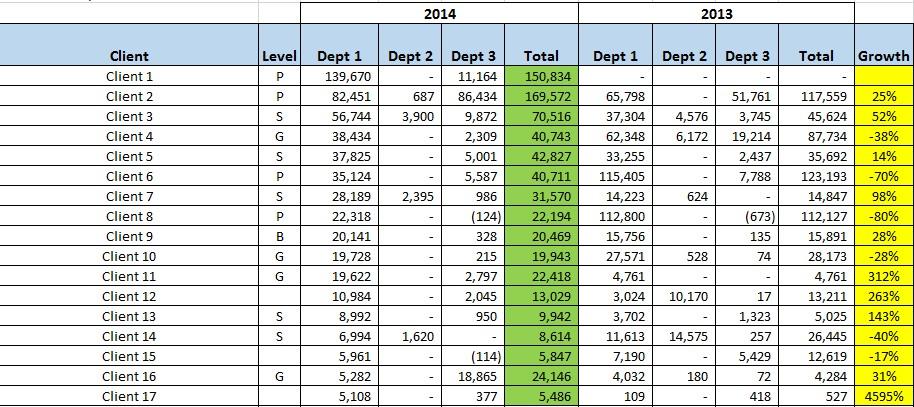
I can not figure out how to calculate either the green column (total of row in group) or the yellow column, which is a percentage growth across years.
My guess is that this is possible using 8 or 9 sub-queries, but I think this would be a very complex and limiting report. Any help would be much appreciated.
I am creating a report that shows revenue per client for several departments over several years. An excel sample is here:
I can not figure out how to calculate either the green column (total of row in group) or the yellow column, which is a percentage growth across years.
My guess is that this is possible using 8 or 9 sub-queries, but I think this would be a very complex and limiting report. Any help would be much appreciated.
Hi Scott,
Thanks for the question and apologies for the delay in responding.
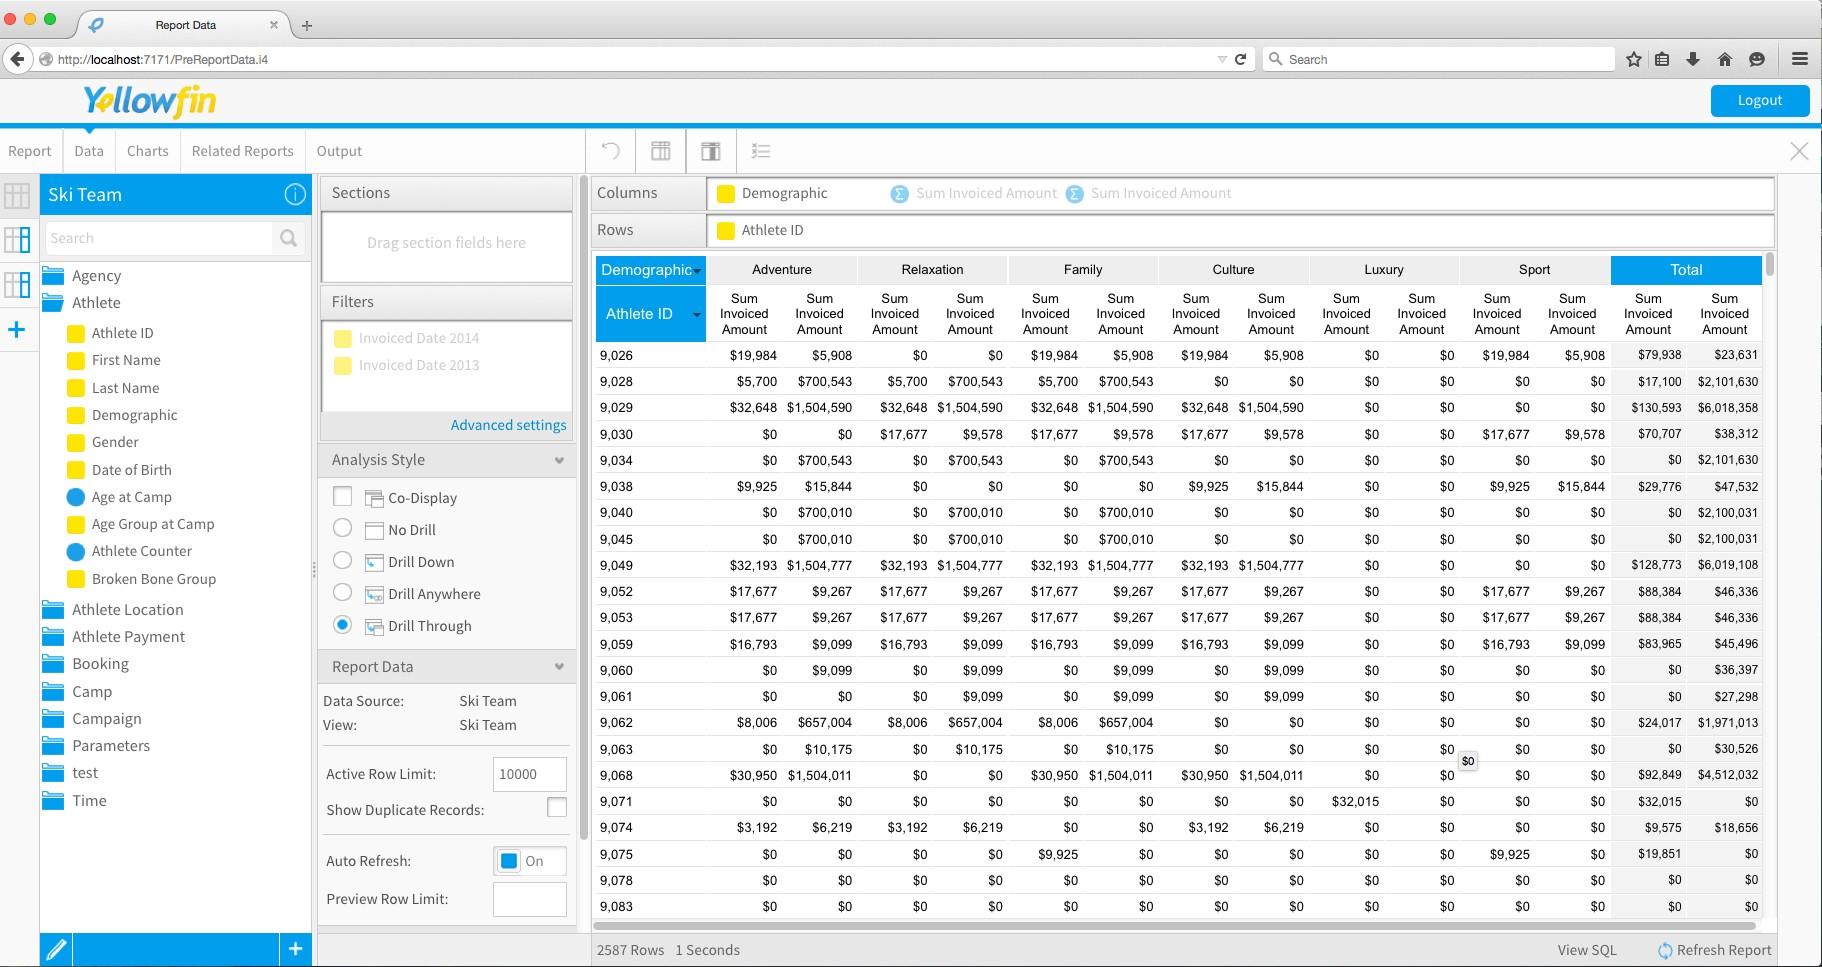
The green column can be achieved pretty easily by activating row totals on your row dimension (in your case client).
I've reproduced a similar chart using our Ski Team database and here is what I was able to create:

As far as the yellow column is concerned, this is where it gets tricky... The problem is that you are using a cross tab report to display your data wherein advanced functions become pretty limited. In a traditional column based report, you could use an advanced function to calculate the percentage of change from one column to the next. However, advanced functions that rely on another column in cross tab reports are unavailable(this has to do with how Yellowfin aggregates data etc).
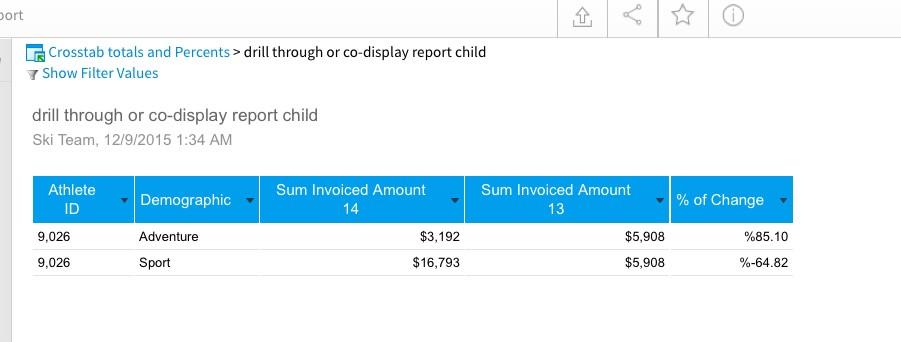
I think what you could consider is creating a second drill through or co-display report to display the percentage of growth for each individual client.
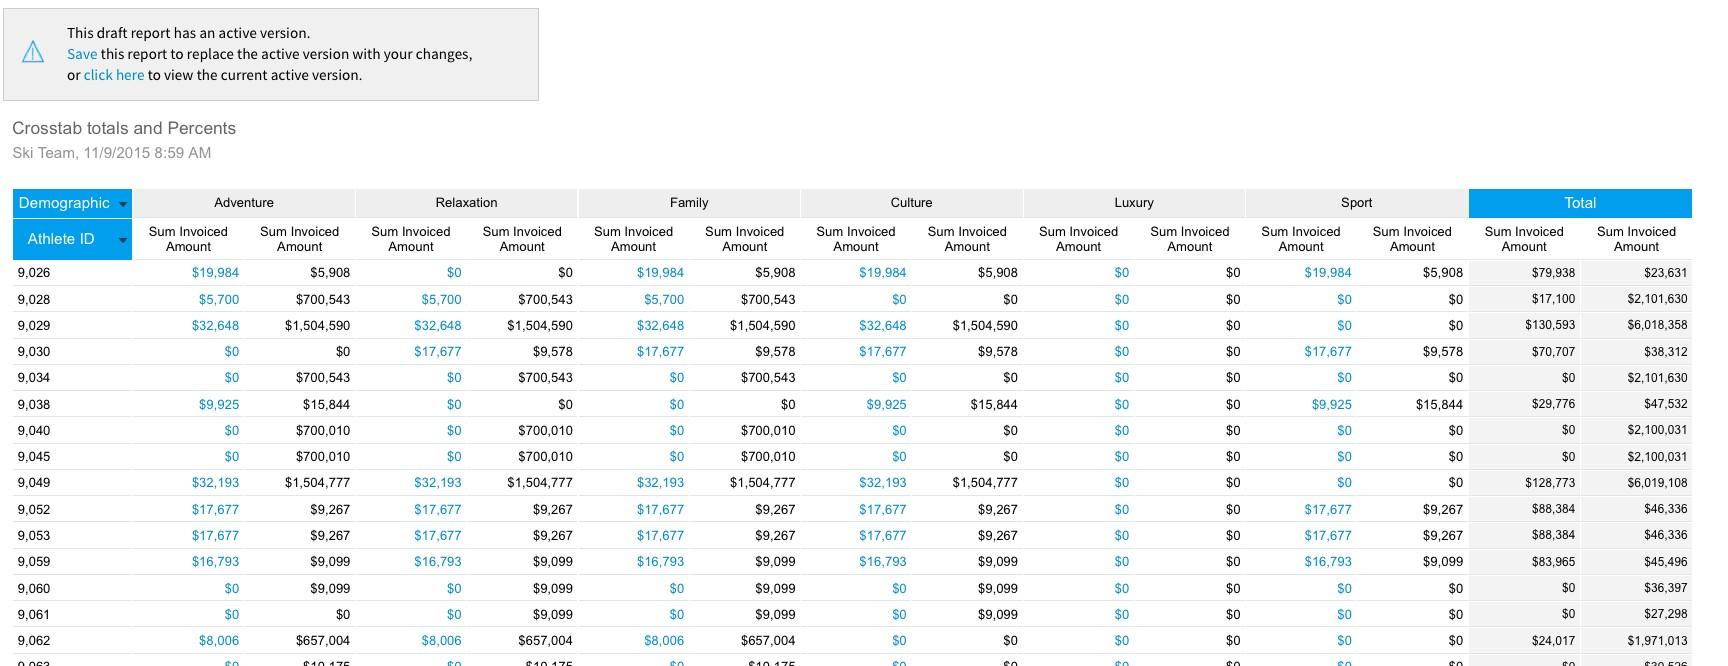
Here are a couple of screenshots demonstrating what this could look like:
Parent Cross Tab Report:
Child Report (after drilling):
Anyway, hopefully this information has been useful. Please let me know if you have any questions or concerns.
Kind Regards,
Dustin
Thanks for the question and apologies for the delay in responding.
The green column can be achieved pretty easily by activating row totals on your row dimension (in your case client).
I've reproduced a similar chart using our Ski Team database and here is what I was able to create:
As far as the yellow column is concerned, this is where it gets tricky... The problem is that you are using a cross tab report to display your data wherein advanced functions become pretty limited. In a traditional column based report, you could use an advanced function to calculate the percentage of change from one column to the next. However, advanced functions that rely on another column in cross tab reports are unavailable(this has to do with how Yellowfin aggregates data etc).
I think what you could consider is creating a second drill through or co-display report to display the percentage of growth for each individual client.
Here are a couple of screenshots demonstrating what this could look like:
Parent Cross Tab Report:
Child Report (after drilling):
Anyway, hopefully this information has been useful. Please let me know if you have any questions or concerns.
Kind Regards,
Dustin