
Dates Filter by Year, Quarter etc
13 March, 2015
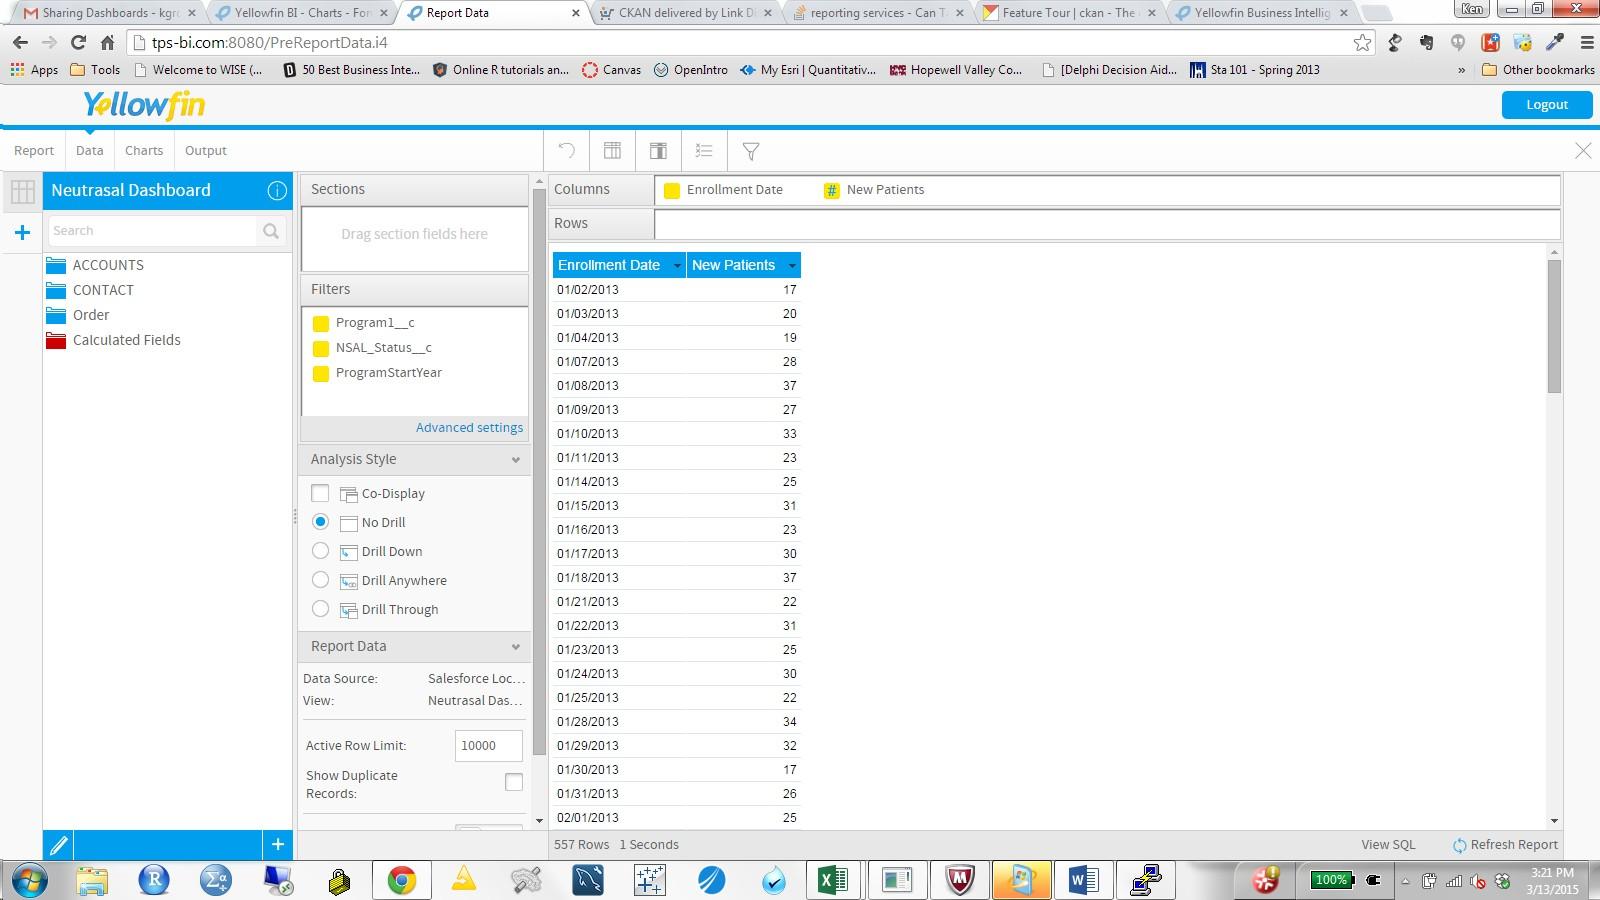
In the past I took this:
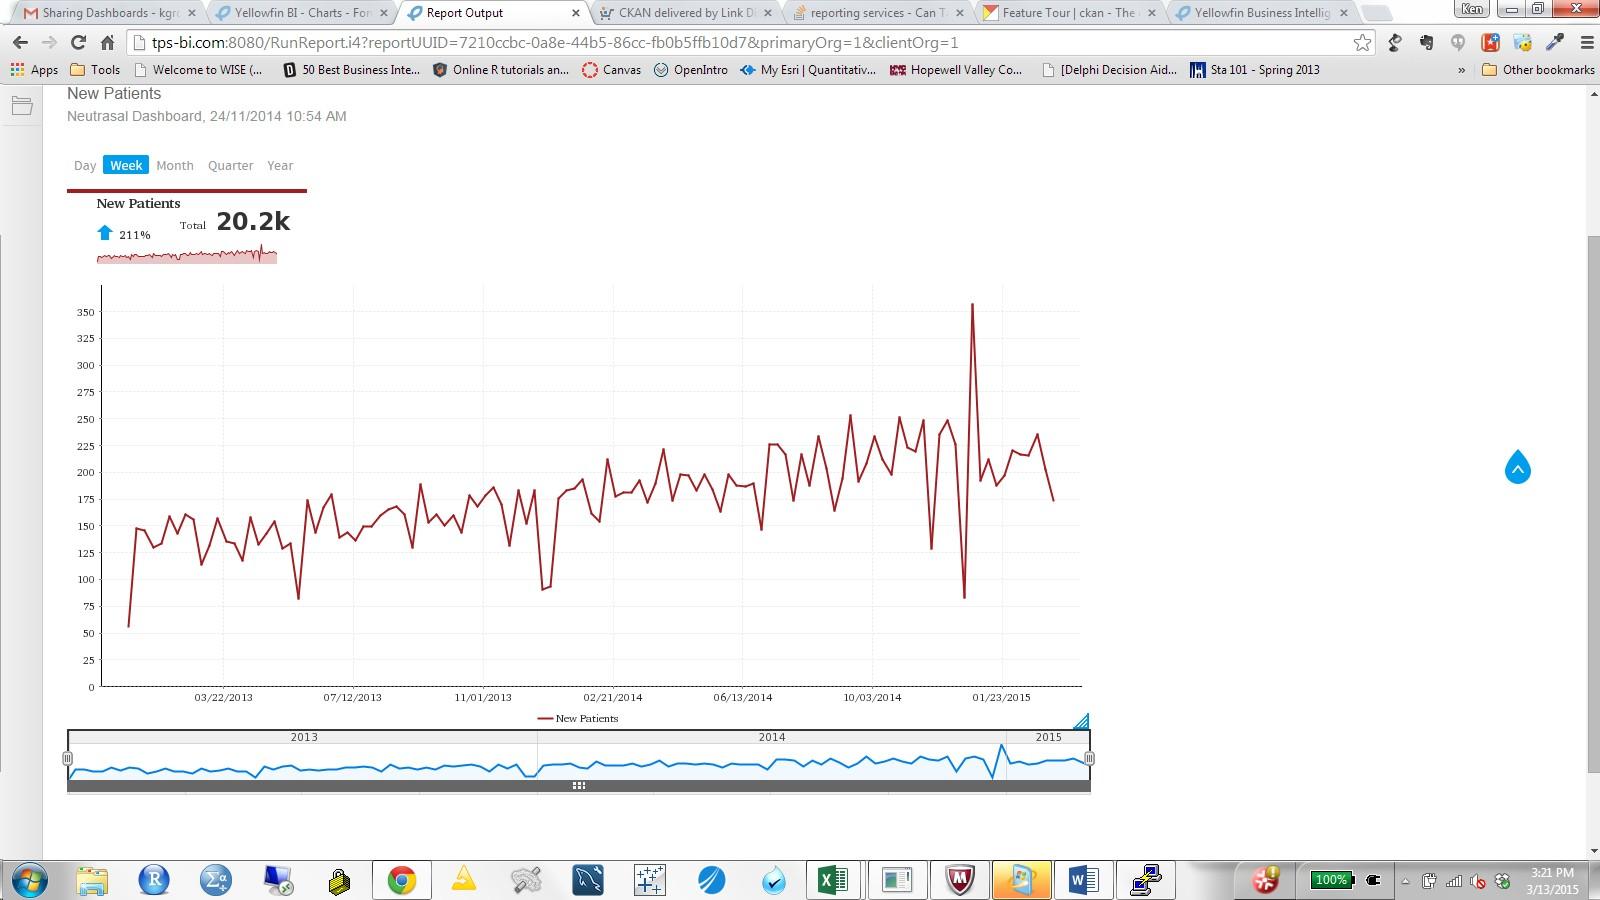
and created this:
I can not remember how I was able to get the live filter option (top left of image 2) to be active. Can anyone direct me to instructions on how this is done?
and created this:
I can not remember how I was able to get the live filter option (top left of image 2) to be active. Can anyone direct me to instructions on how this is done?
Hello,
Thank you for posting your question on the forum.
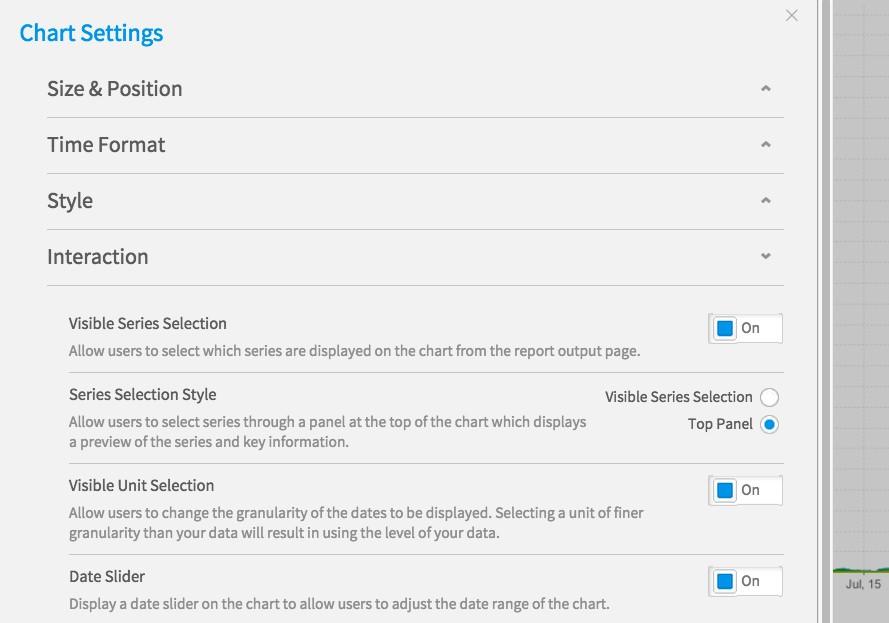
In order to get those filter options that you have pointed out you will need
to have Visible Unit Selection set to ON -

This should make those filters selectable on the Output page.
Let us know if this was what you were after.
Thank you,
Kyle
Thank you for posting your question on the forum.
In order to get those filter options that you have pointed out you will need
to have Visible Unit Selection set to ON -
This should make those filters selectable on the Output page.
Let us know if this was what you were after.
Thank you,
Kyle
Thank you for the quick reply. That was what I was looking for. I do have a followup questions.
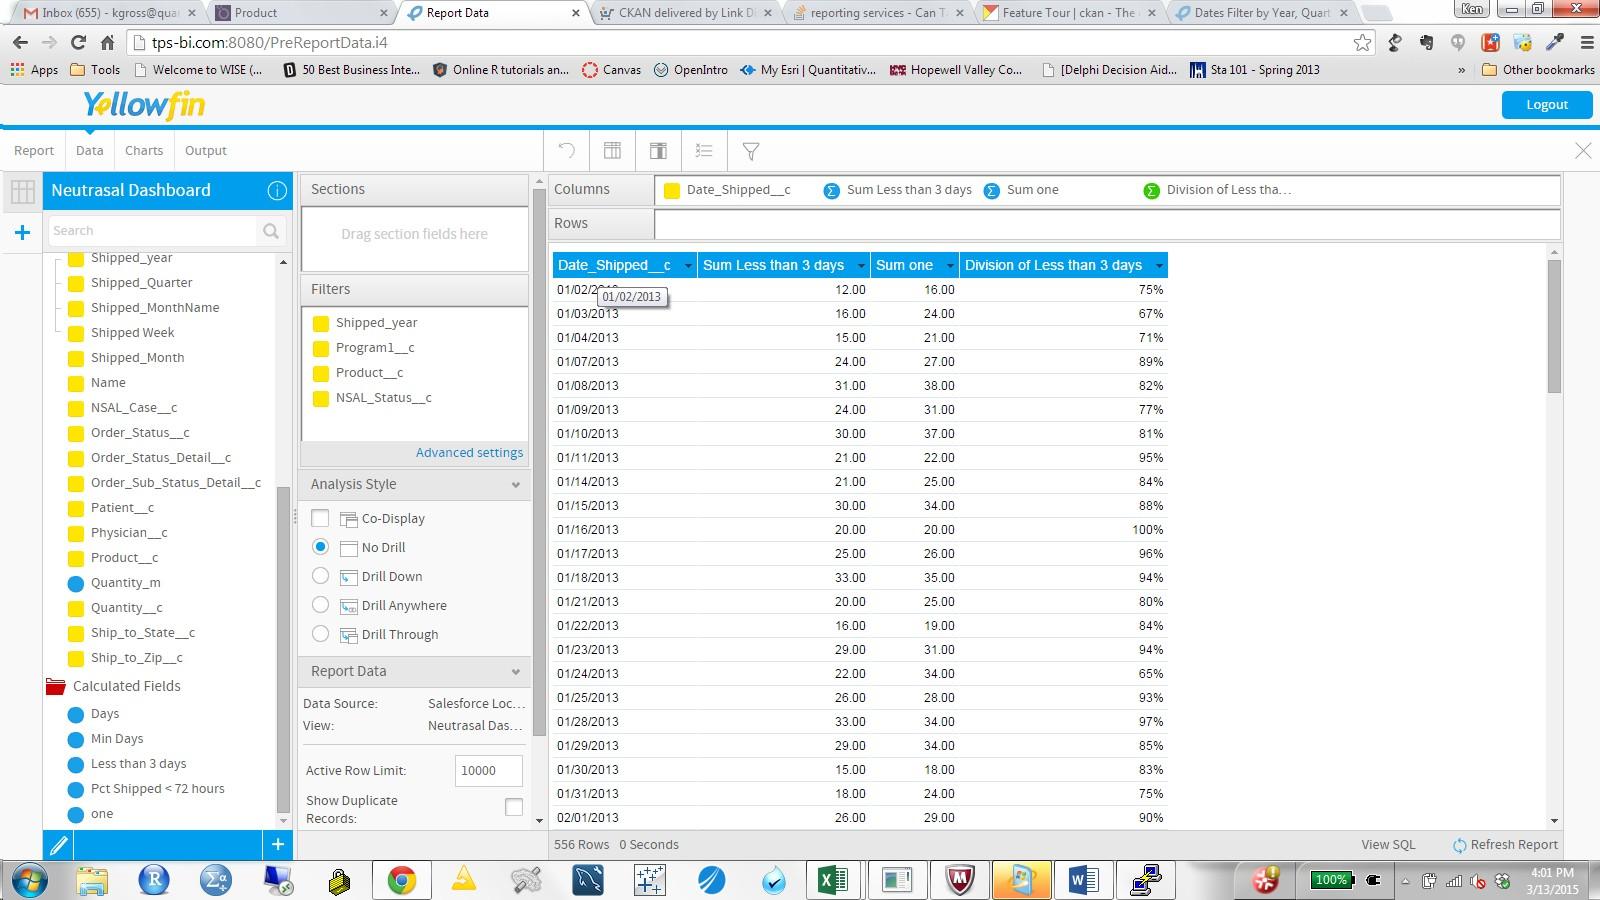
My data is slightly different than the example I included before. My data looks like this, where a % is calculated by date.
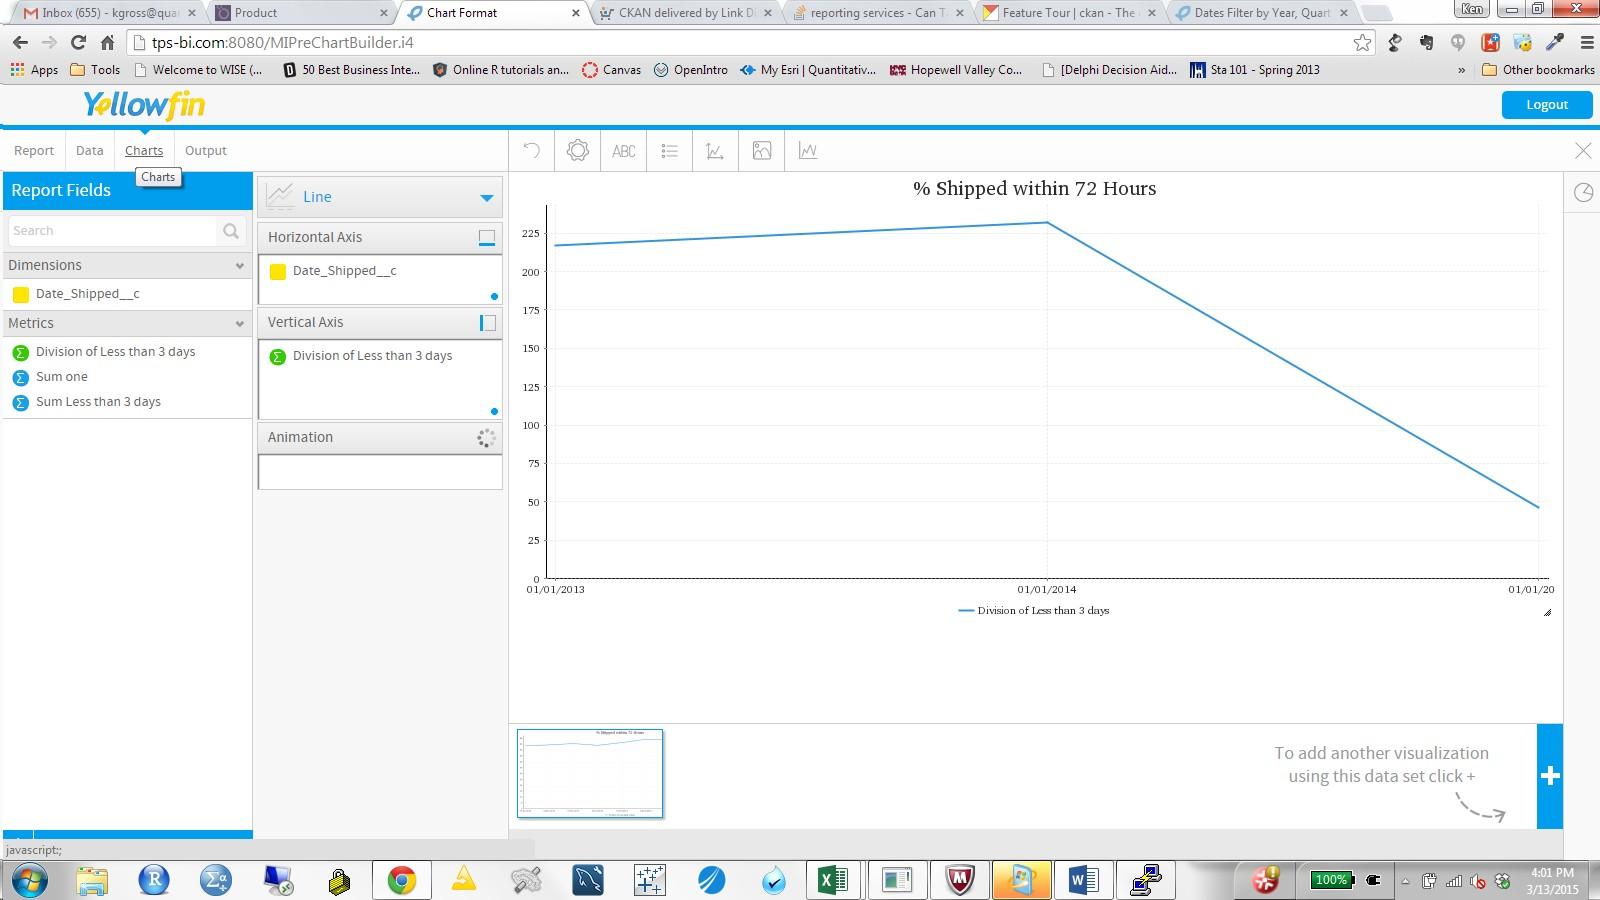
I would like it to recalculate that % on the fly as the date option is changed (i.e. year, quarter etc.). When I take the data above I get the following which is not calculating % on the fly correctly.
My data is slightly different than the example I included before. My data looks like this, where a % is calculated by date.
I would like it to recalculate that % on the fly as the date option is changed (i.e. year, quarter etc.). When I take the data above I get the following which is not calculating % on the fly correctly.
Hello,
I don't believe that what you are trying to do with Series Selection is possible.
How is your 'Date Shipped' field formatted? Does it give you the option to
select Time Series on the Chart Builder? If not, you won't be able to change
the granularity of the dates to be displayed.
Please let me know if I've misunderstood your question.
I've also included the link to Wiki which covers Series Selection Setup.
Series Selection
Thank you,
Kyle
"Date shipped" does have time series option checked. It is not the granularity of the dates that is the problem it is the recalculation of the percentage when changing the date granularity.
The problem here is, as you've said, more to do with how the chart is recalculating the percentage value as you're changing the granularity using the unit selection options. Yellowfin aggregates the chart data for unit selection on the fly, it doesn't rerun the query with the new granularity.
At the moment, from the screenshots, it looks like you're using an Advanced Function in order to apply the division between the two fields in your table. The way advanced functions work is that they are calculated outside of the SQL, after the results are actually returned from the database.
From here, when you change the granularity of the chart, instead of performing the calculation, Yellowfin just aggregates the data using sum (or whatever was applied to the field). This will be causing undesired results in your scenario.
We also had a look at creating a calculated field, rather than using an Advanced Function. The problem here is that we couldn't put an aggregation on an aggregation. So we did:
SUM(ColumnA) / SUM(ColumnB) * 100
We then would need to apply an AVERAGE aggregation on top, so that when Yellowfin tries to aggregate the data in the chart (when you change from say date to month) it averages.
Unfortunately there is no way to achieve what you're after at the moment. The best solution I could suggest would be to create a chart designed at a higher level granularity (say month or year), and then allow the user to drill through or drill down to a lower level. Drilling will rerun the SQL and should provide you with accurate percentage calculations.
Regards,
Teresa