
Editing Chart and Export report into pdf files.
29 April, 2014
Dear Team Support,
I have a problem here. When I created a report that contains of 3 charts (multiple chart) from one source and activated the report, something wrong with the report for editing. When I wanted to the report, it takes too long time and show error "Oh no! An error occurred saving your details to the database. Please try again later "
I was thinking that maybe my data isn't correct. But then, I made a report like the report before (multiple chart) using Ski Team. The result is same. Why is that?
A error result is showed when I am trying to exporting reports to pdf files. How to fixing it?
And for the last question, How to make a column chart able to scroll left and right when is showing on dashboard?
All these questions is about Yellowfin 7.
Thank you for your Attention.
--
Nonie Purba
Hi Nonie,
I have done some testing on this in Yellowfin 7 (April release) and not able to replicate any issues with multi-charts and then exporting them to PDF.
Are you able to provide some more info on what you're facing?
Also, please shoot across the information under Admin > System Information so we can see what build you're using.
In regards to your scroll bar, if the report is too big to fit in the dashboard, it should automatically contain a scroll bar, so not really sure why it wouldn't be there. Could you also provide some screenshots on this, and what browser you are using.
Thanks,
David
Hi Nonie,
Great to hear that the queries with multi-charts and exporting to PDF have been resolved. Re the scroll bar I hope the info below will help.
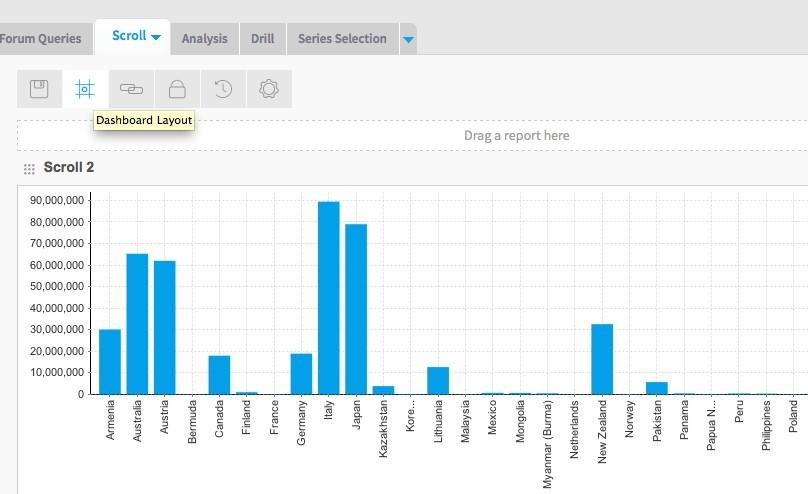
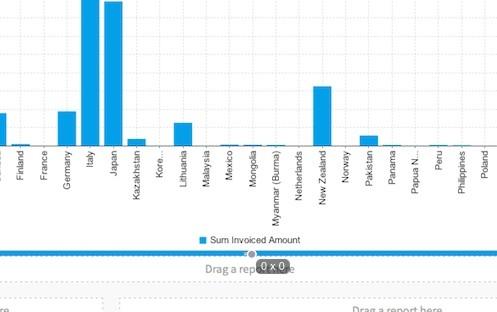
If you are displaying tables that are quite large a scroll bar will appear, but you will be unable to access a scroll bar for a chart, as they will be automatically resized to fit in the portlet (the little boxes). Portlets can be resized vertically only, as it is the only way to make sure it all fits. The dashboard automatically sets the report width, which cannot be changed. The reason for this is to ensure that everything fits within the dashboard.
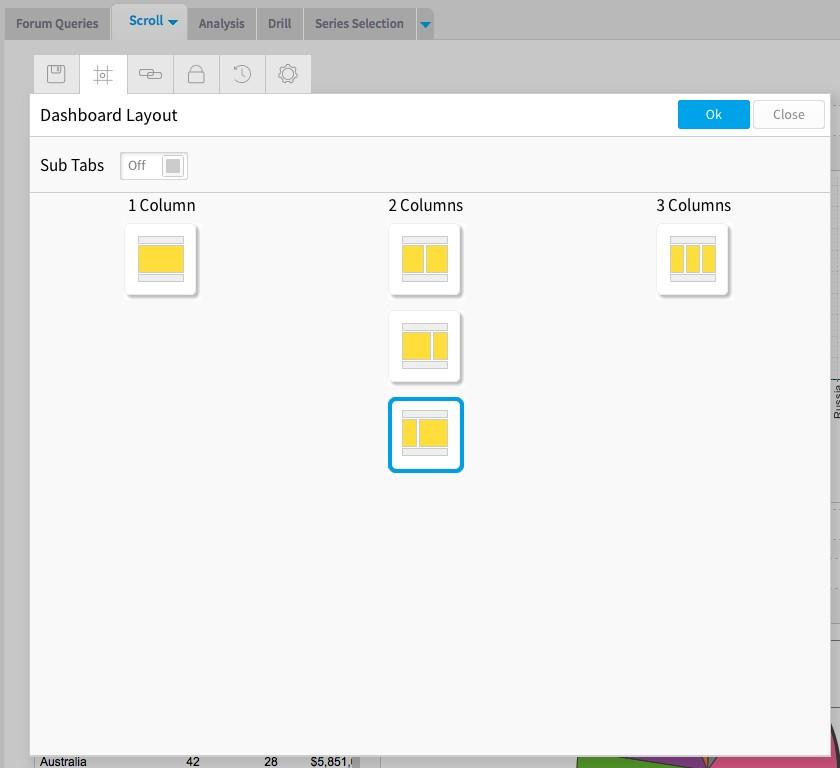
My suggestion would be to explore the Dashboard Layout menu, where you can explore the possible layouts and place you chart in one of the larger portlets and then drag the portlet down to increase the height.

Hope this helps.
Regards,
Katie
Great to hear that the queries with multi-charts and exporting to PDF have been resolved. Re the scroll bar I hope the info below will help.
If you are displaying tables that are quite large a scroll bar will appear, but you will be unable to access a scroll bar for a chart, as they will be automatically resized to fit in the portlet (the little boxes). Portlets can be resized vertically only, as it is the only way to make sure it all fits. The dashboard automatically sets the report width, which cannot be changed. The reason for this is to ensure that everything fits within the dashboard.
My suggestion would be to explore the Dashboard Layout menu, where you can explore the possible layouts and place you chart in one of the larger portlets and then drag the portlet down to increase the height.
Hope this helps.
Regards,
Katie
Hi Katie,
Thank you for your answer Katie.
I just want to make it clear.
So, bars only fit automatically on the dashboard, right?
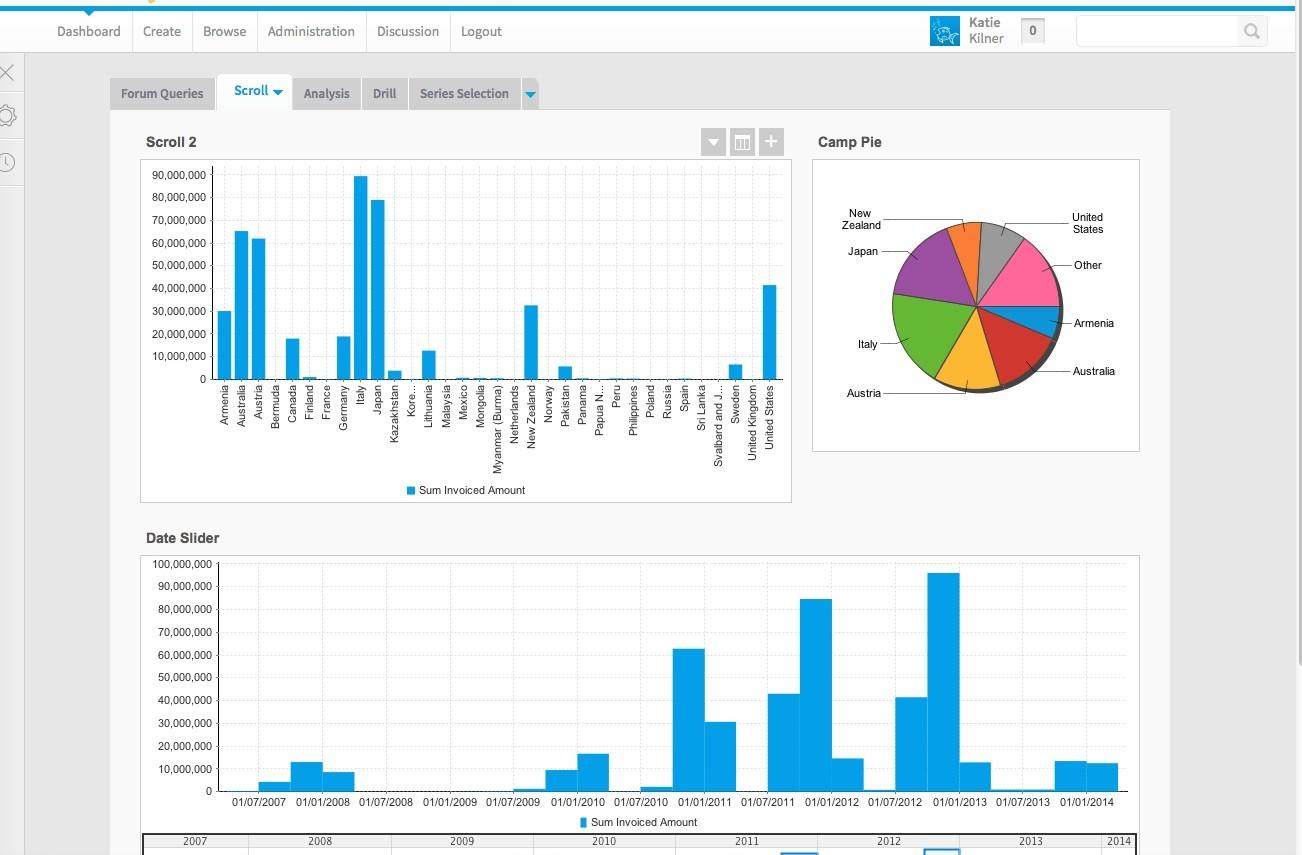
So, we can't set a column chart only display 10 bars on first display, then left-right scroll bar to show other bars.
The bars fit automatically in dashboard layout.
Thank you,
--
Nonie Purba
Thank you for your answer Katie.
I just want to make it clear.
So, bars only fit automatically on the dashboard, right?
So, we can't set a column chart only display 10 bars on first display, then left-right scroll bar to show other bars.
The bars fit automatically in dashboard layout.
Thank you,
--
Nonie Purba
Hi Nonie,
Yes, you are correct. The dashboard will automatically resize the chart to fit in the portlet you have chosen.
I am not sure if this will help but one idea could be to use brushing. Here is a link to Yellowfin's wiki. This would allow you to highlight and select the section of the chart you want to focus on.
I hope this helps and any other questions just let me know.
Regards,
Katie
Yes, you are correct. The dashboard will automatically resize the chart to fit in the portlet you have chosen.
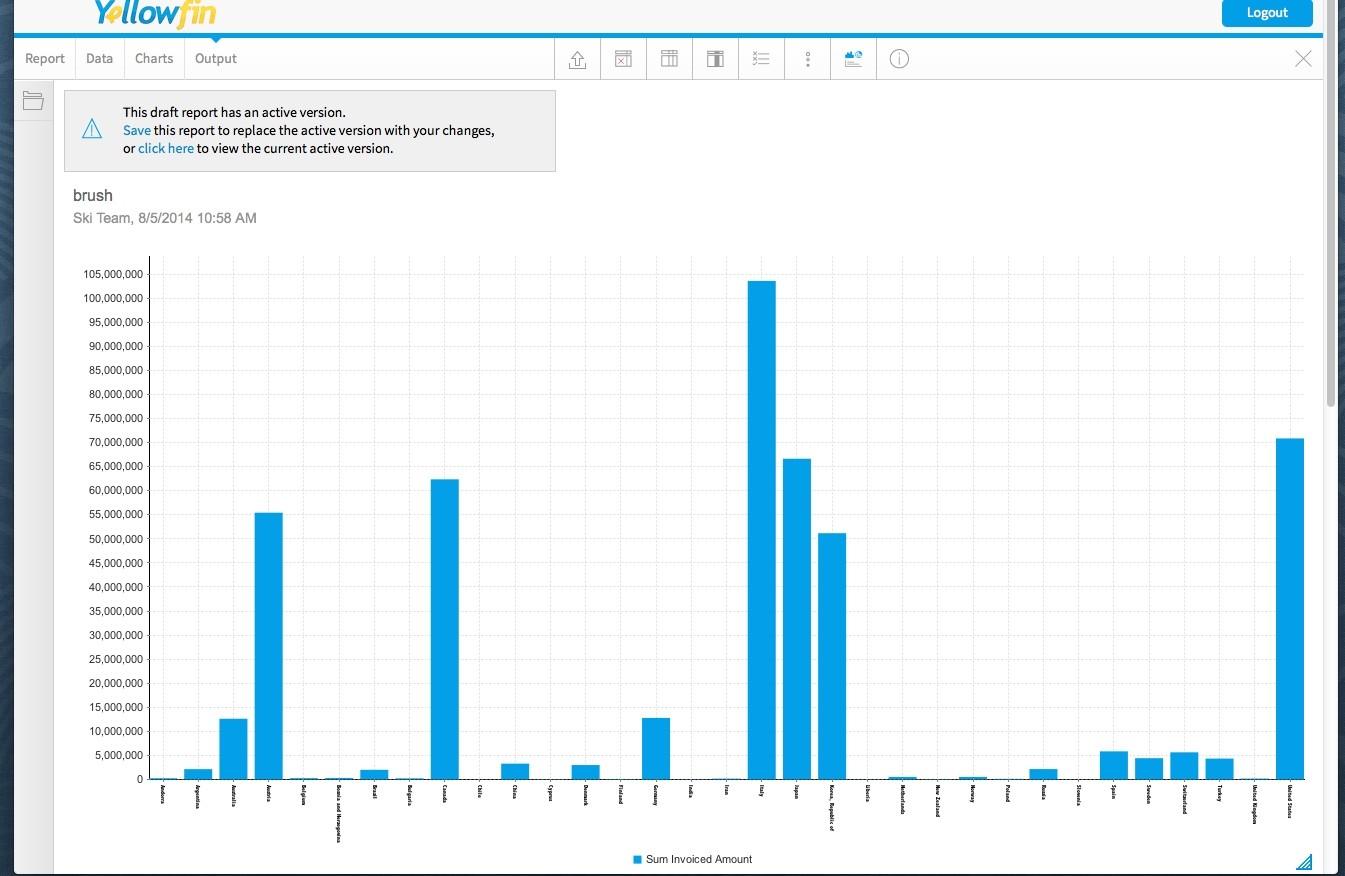
I am not sure if this will help but one idea could be to use brushing. Here is a link to Yellowfin's wiki. This would allow you to highlight and select the section of the chart you want to focus on.
I hope this helps and any other questions just let me know.
Regards,
Katie
Hi Katie,
Thank you for your help. :D
Best regards,
--
Nonie Purba
Thank you for your help. :D
Best regards,
--
Nonie Purba