
GIS Map from WKT Polygons. No chart results.
1 November, 2013
Hi
I'm trying to generate a GIS Map using WKT from a text field.
My database table consists of three fields:
- WKT Polygon. Text datatype.
- Zipcode. Text datatype.
- Area. Double datatype.
My View has the WKT field set to a Dimension and added the "Converted Data Type: GIS Geometry" converter. The field is active.
My Report is "Table and Chart".
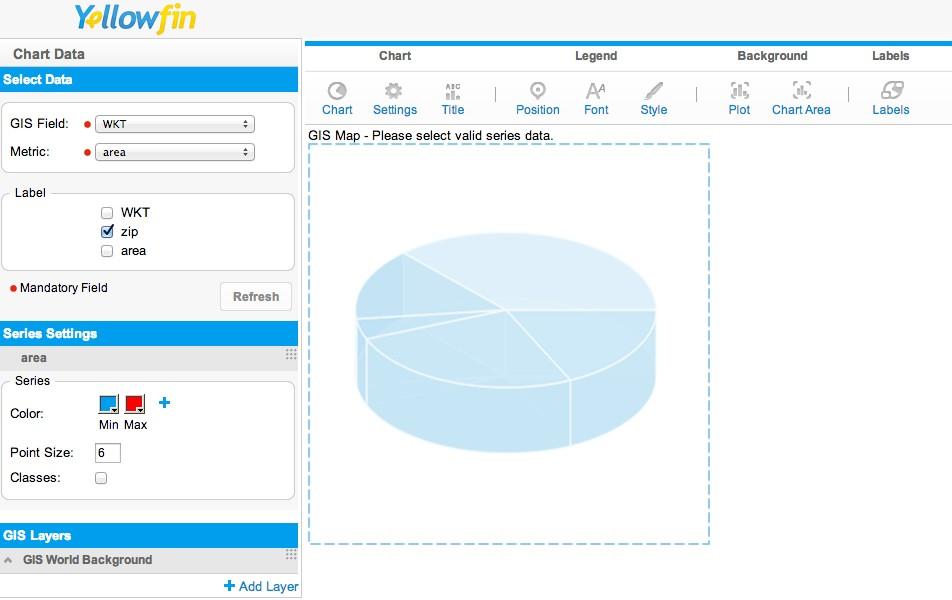
On the "Chart Data" page,
GIS Field is set to my "WKT" field
Metric is set to my "area" field
Label is set to my "zip" field
When I click "Refresh", the phrase "GIS Map - Please select valid series data." is displayed above the "blank pie chart" image.
I have the filter set to 43317, so I expect to see one row in the table.
When I display the report, the table shows the one row that I expected.
However, my chart still shows the "blank pie chart" image.
How do display the WKT polygon on a map? Do I have to add map layers too? If I add the "GIS World Background" as a layer, nothing changes. I would expect to see a World Map with a tiny polygon drawn around the zipcode for 43317.
Here is an example row from that table. Let me know what else you need to diagnose this problem.

"POLYGON ((-96.41159 28.845910999998623,-96.371393 28.855973999998628,-96.341157 28.858569999998625,-96.341262 28.860127999998628,-96.345608 28.862760999998628,-96.358567 28.862712999998628,-96.359702 28.888333999998626,-96.382991 28.88789899999863,-96.380168 28.896411999998627,-96.379341 28.897303999998631,-96.379679 28.90774099999863,-96.380078 28.917510999998623,-96.368593 28.917950999998627,-96.368594 28.919920999998624,-96.354717 28.920688999998628,-96.312824 28.921510999998628,-96.31371 28.916516999998631,-96.314699 28.916219999998628,-96.315714 28.913813999998624,-96.311184 28.911477999998631,-96.315301 28.829110999998633,-96.316153 28.828676999998628,-96.321096 28.829707999998632,-96.324425 28.831356999998633,-96.327131 28.833418999998631,-96.329706 28.834151999998628,-96.331215 28.833074999998633,-96.331267 28.832203999998629,-96.338289 28.825469999998631,-96.340553 28.826385999998621,-96.341932 28.827576999998637,-96.342686 28.827484999998628,-96.343726 28.82452899999863,-96.341853 28.823292999998632,-96.340578 28.82301799999863,-96.340448 28.822215999998633,-96.346506 28.821189999998637,-96.347811 28.821810999998629,-96.350824 28.818135999998628,-96.350577 28.811649999998629,-96.35107 28.810352999998628,-96.353339 28.809311999998627,-96.378056 28.808916999998633,-96.378354 28.832648999998632,-96.403534 28.831832999998632,-96.406528 28.835271999998628,-96.406188 28.83905199999862,-96.406942 28.840792999998634,-96.410063 28.843542999998629,-96.412379 28.843818999998636,-96.41159 28.845910999998623))" 43001 0.006425
I'm trying to generate a GIS Map using WKT from a text field.
My database table consists of three fields:
- WKT Polygon. Text datatype.
- Zipcode. Text datatype.
- Area. Double datatype.
My View has the WKT field set to a Dimension and added the "Converted Data Type: GIS Geometry" converter. The field is active.
My Report is "Table and Chart".
On the "Chart Data" page,
GIS Field is set to my "WKT" field
Metric is set to my "area" field
Label is set to my "zip" field
When I click "Refresh", the phrase "GIS Map - Please select valid series data." is displayed above the "blank pie chart" image.
I have the filter set to 43317, so I expect to see one row in the table.
When I display the report, the table shows the one row that I expected.
However, my chart still shows the "blank pie chart" image.
How do display the WKT polygon on a map? Do I have to add map layers too? If I add the "GIS World Background" as a layer, nothing changes. I would expect to see a World Map with a tiny polygon drawn around the zipcode for 43317.
Here is an example row from that table. Let me know what else you need to diagnose this problem.
"POLYGON ((-96.41159 28.845910999998623,-96.371393 28.855973999998628,-96.341157 28.858569999998625,-96.341262 28.860127999998628,-96.345608 28.862760999998628,-96.358567 28.862712999998628,-96.359702 28.888333999998626,-96.382991 28.88789899999863,-96.380168 28.896411999998627,-96.379341 28.897303999998631,-96.379679 28.90774099999863,-96.380078 28.917510999998623,-96.368593 28.917950999998627,-96.368594 28.919920999998624,-96.354717 28.920688999998628,-96.312824 28.921510999998628,-96.31371 28.916516999998631,-96.314699 28.916219999998628,-96.315714 28.913813999998624,-96.311184 28.911477999998631,-96.315301 28.829110999998633,-96.316153 28.828676999998628,-96.321096 28.829707999998632,-96.324425 28.831356999998633,-96.327131 28.833418999998631,-96.329706 28.834151999998628,-96.331215 28.833074999998633,-96.331267 28.832203999998629,-96.338289 28.825469999998631,-96.340553 28.826385999998621,-96.341932 28.827576999998637,-96.342686 28.827484999998628,-96.343726 28.82452899999863,-96.341853 28.823292999998632,-96.340578 28.82301799999863,-96.340448 28.822215999998633,-96.346506 28.821189999998637,-96.347811 28.821810999998629,-96.350824 28.818135999998628,-96.350577 28.811649999998629,-96.35107 28.810352999998628,-96.353339 28.809311999998627,-96.378056 28.808916999998633,-96.378354 28.832648999998632,-96.403534 28.831832999998632,-96.406528 28.835271999998628,-96.406188 28.83905199999862,-96.406942 28.840792999998634,-96.410063 28.843542999998629,-96.412379 28.843818999998636,-96.41159 28.845910999998623))" 43001 0.006425
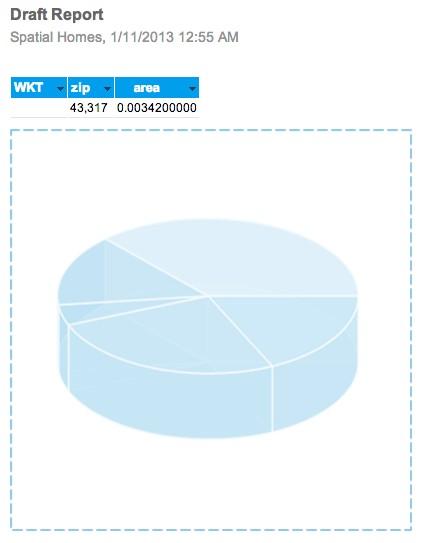
Here is the Draft Report. Note that the row is displayed in the table just fine, but the WKT field is showing up blank (which is somewhat expected since it's being converted to a GIS datatype).
Hi,
Sorry you're having issues with the WKT converter, and all the info you have provided.
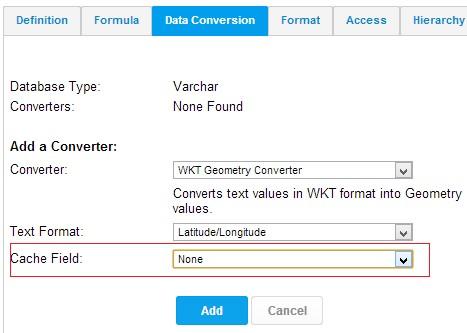
Are you caching the field into another field?
e.g.
If so.
I believe this issue was raise last month (TASK ID = 143658) and included in the 6.3 October release.
If not.
What version of Yellowfin are you currently using and what is the database you are using for both YF & the data source?
Thanks,
David
Sorry you're having issues with the WKT converter, and all the info you have provided.
Are you caching the field into another field?
e.g.
If so.
I believe this issue was raise last month (TASK ID = 143658) and included in the 6.3 October release.
If not.
What version of Yellowfin are you currently using and what is the database you are using for both YF & the data source?
Thanks,
David
Hi David,
I'm not using a cache field.
I'm using YF 6.3, MySQL for YF and sqlite for my data + WKT field.
BTW (separate issue), I'm trying to figure out how to use spatialite for my geo data, but don't see how to get YF to get the JDBC driver to load sqlite extensions.
Thanks,
John
I'm not using a cache field.
I'm using YF 6.3, MySQL for YF and sqlite for my data + WKT field.
BTW (separate issue), I'm trying to figure out how to use spatialite for my geo data, but don't see how to get YF to get the JDBC driver to load sqlite extensions.
Thanks,
John
I tried using the same data with a "GIS Google Map" with similar results; the polygons don't show up on the Google map.
Still getting the "GIS Map - Please select valid series data." message.
Hi,
The column should not return a blank row. No data is being returned from the converter which is why the chart is not displaying.
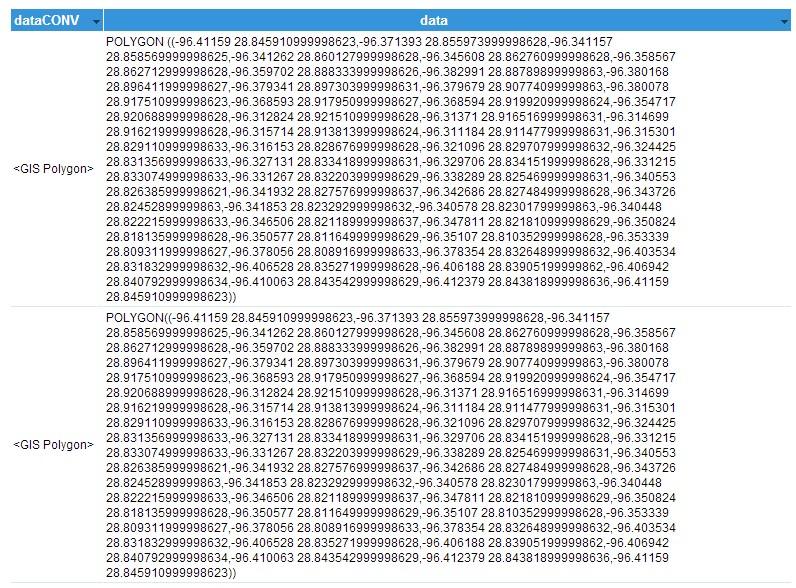
I have taken your data and inserted it into my SQL Server DB as Varchar(MAX) and also into MySQL as TEXT.
I have then applied the WKT converter to both, and results are returned correctly in YF.
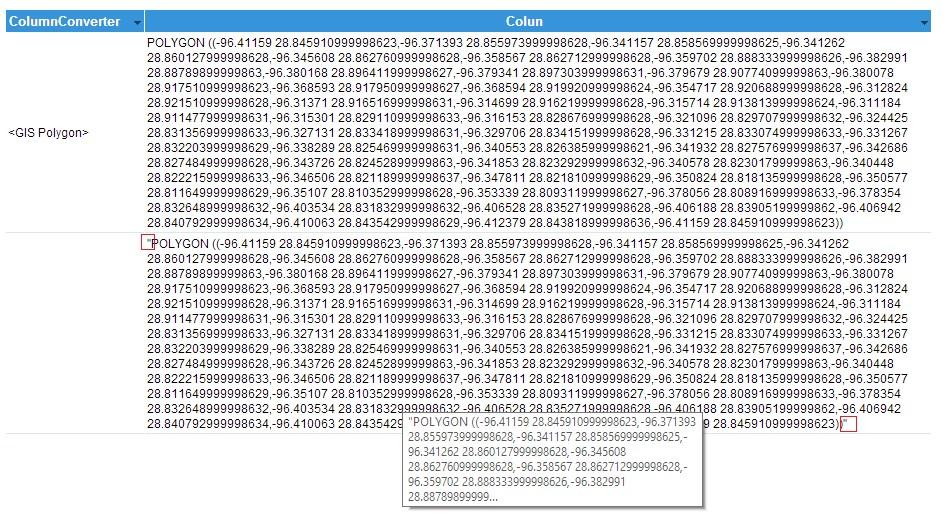
See screenshot below ('dataCONV' is the column with the WKT converter) :
I did however manage to get a blank row when I had " " in the DB.
E.g.
"POLYGON ((-96.41159 28.845910999998623,-96.371393 28.855973999998628,-96.341157 ......))"
-This didn't work.
POLYGON ((-96.41159 28.845910999998623,-96.371393 28.855973999998628,-96.341157 ......))
-This works.
Do you have " in your actual db column? If so, can you please remove and try.
Also, which exact version of YF are you using?
You can get this via 'system information' under Administration.
In terms of using 'spatialite' to return geometry data.
In order for YF to recognise these types as actual geo data, we need to change our code so we can can also add 'Spatialite' under the support list. Which at this point it is not. I have raised an enhancement request for this (TASK ID = 148517).
If you wanted to add your own JDBC drivers for use in YF, the following post should contain all info on this : How to add a new JDBC driver for use in YF .
Please let us know in regards to the " data.
Regards,
David
The column should not return a blank row. No data is being returned from the converter which is why the chart is not displaying.
I have taken your data and inserted it into my SQL Server DB as Varchar(MAX) and also into MySQL as TEXT.
I have then applied the WKT converter to both, and results are returned correctly in YF.
See screenshot below ('dataCONV' is the column with the WKT converter) :
I did however manage to get a blank row when I had " " in the DB.
E.g.
"POLYGON ((-96.41159 28.845910999998623,-96.371393 28.855973999998628,-96.341157 ......))"
-This didn't work.
POLYGON ((-96.41159 28.845910999998623,-96.371393 28.855973999998628,-96.341157 ......))
-This works.
Do you have " in your actual db column? If so, can you please remove and try.
Also, which exact version of YF are you using?
You can get this via 'system information' under Administration.
In terms of using 'spatialite' to return geometry data.
In order for YF to recognise these types as actual geo data, we need to change our code so we can can also add 'Spatialite' under the support list. Which at this point it is not. I have raised an enhancement request for this (TASK ID = 148517).
If you wanted to add your own JDBC drivers for use in YF, the following post should contain all info on this : How to add a new JDBC driver for use in YF .
Please let us know in regards to the " data.
Regards,
David
Hi,
I am also facing the same problem,but i am getting the chart partially. I have a data of 25 states in India. In my chart i am getting GIS map for only 3 states for which there is only one row of data(rest have multiple rows of data).In my data there are polygons for some states and multipolygons for some states.. I tried removing Quotes(") but it didn't work.Do i have to remove the quotes just before polygon/multipolygon or do i have to remove the complete quotes in my data??
I am also facing the same problem,but i am getting the chart partially. I have a data of 25 states in India. In my chart i am getting GIS map for only 3 states for which there is only one row of data(rest have multiple rows of data).In my data there are polygons for some states and multipolygons for some states.. I tried removing Quotes(") but it didn't work.Do i have to remove the quotes just before polygon/multipolygon or do i have to remove the complete quotes in my data??
Thanks David, the double-quote was being stored in the raw text. Once I removed the quotes I immediately was able to use the maps!
WRT the spatialite; thank you for submitting that enhancement request.
WRT the spatialite; thank you for submitting that enhancement request.
Hi,
That is awesome news.
Also to the 'other' guest, you will need to remove the quotes for the entire row as shown in the example :
[code]
"POLYGON ((-96.41159 28.845910999998623,-96.371393 28.855973999998628,-96.341157 ......))"
[/code]
-This didn't work.
[code]
POLYGON ((-96.41159 28.845910999998623,-96.371393 28.855973999998628,-96.341157 ......))
[/code]
-This works.
Please let us know how it goes.
Regards,
David