
How can I split a stack chart into bars when only one stack bar is there
6 September, 2012
My question is how can I split a stack chart into bars when only one stack bar is there.
I mean to say let suppose my Initial chart is
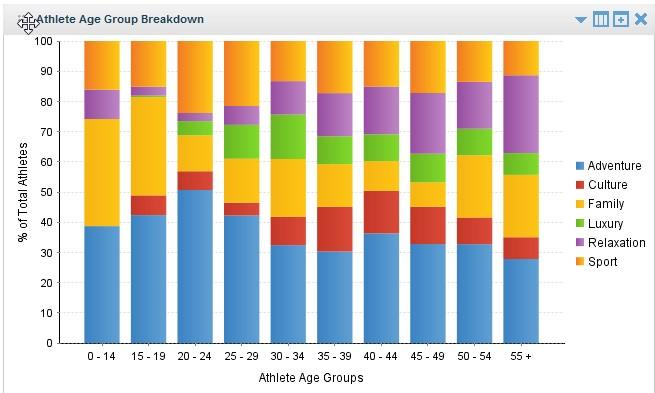
This looks fine.
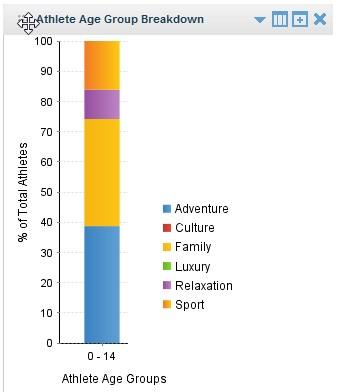
Now, if I left with only one stack bar as shown in the below Image, I want 4 different bars instead of only one.
I hope I am very clear, if not please feel free to ask.
Thanks in Advance.
I mean to say let suppose my Initial chart is
This looks fine.
Now, if I left with only one stack bar as shown in the below Image, I want 4 different bars instead of only one.
I hope I am very clear, if not please feel free to ask.
Thanks in Advance.
Hello,
Changing your chart type to 'Vertical Bar' should split each distinct label into multiple bars. For you last example you would have six bars if using a Vertical Bar chart.
Regards,
Cameron
Changing your chart type to 'Vertical Bar' should split each distinct label into multiple bars. For you last example you would have six bars if using a Vertical Bar chart.
Regards,
Cameron
Thanks Cameron, actually I want this functionality at run time, i.e when there are more than 1 bars then my graph should look like Fig 1 (Stack column) however, when I only left with single bar then all stack items in that single bar split up and rebuilt to become vertical Bars. For eg: Instead of 1 bar with 4 items stacked one over another, I want 4 different vertical bars.
Hope I am clear now.
Thanks,
Neeraj Jindal
Hope I am clear now.
Thanks,
Neeraj Jindal
Hi Neeraj,
Yes that makes perfect sense now. For your example, there is no way for reports to dynamically change type at run time. These settings will have to be statically configured for the report.
Thanks,
Cameron
Yes that makes perfect sense now. For your example, there is no way for reports to dynamically change type at run time. These settings will have to be statically configured for the report.
Thanks,
Cameron
Hi Neeraj,
Changing your chart type is probably not a very good idea anyway. This would be very confusing if you are used to seeing the data represented one way, then it changes to another way if you only have one stack. This goes against the idea of providing a consistent view of your data.
Dave
Changing your chart type is probably not a very good idea anyway. This would be very confusing if you are used to seeing the data represented one way, then it changes to another way if you only have one stack. This goes against the idea of providing a consistent view of your data.
Dave