
How do I set colours for bars on vertical stacked chart?
26 March, 2014
With some reports, the colouring of the chart is derived from the conditional formatting set upon the table. This doesn't appear to work with the stacked vertical chart. Is this a defect, am I doing something wrong, or is there another way to manually select the bar colours on the chart?
See attached picture.
The report is showing the investigation status for incidents across different regions. The blue is currently showing Completed investigations (needs to be green as per conditional formatting in table at the top), Not Started and Underway also need to match the colours that have been formatted in the chart. How do I achieve this?
Hi Mike,
Your attachment did not come through.
I believe though that what you are after, is addressed in this forum post:
How to set the custom color setting for PieChar, BarChart...Etc...?
Please let me know if this is what you are after
Regards,
Stephen
Your attachment did not come through.
I believe though that what you are after, is addressed in this forum post:
How to set the custom color setting for PieChar, BarChart...Etc...?
Please let me know if this is what you are after
Regards,
Stephen
Hi Stephen,
Sorry about that - not sure what happened there. I have reattached. What you have mentioned above is what I'm trying to achieve and what I have tried but it won't seem to work. I should also mention that I'm using version 6.3 build 20140224.
I have reattached the image.
Thanks,
Mike
Sorry about that - not sure what happened there. I have reattached. What you have mentioned above is what I'm trying to achieve and what I have tried but it won't seem to work. I should also mention that I'm using version 6.3 build 20140224.
I have reattached the image.
Thanks,
Mike
Hi Mike,
In your case you do not need conditional formatting to format the chart.
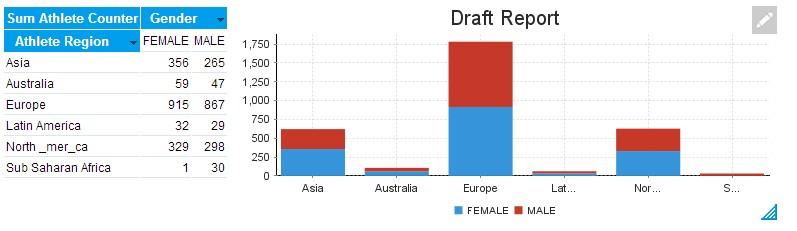
Below is an example of a simple Crosstab Report, displaying the number of male/female athletes per region in a Stacked Bar Chart.

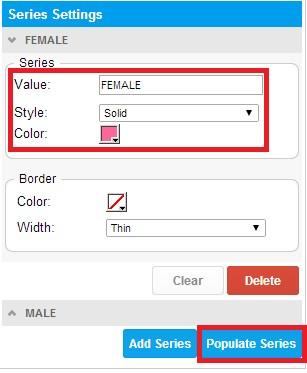
I first Populate the Series, and then changed the color to pink for female athletes and blue for male athletes, using the Charts Series Settings as follows:
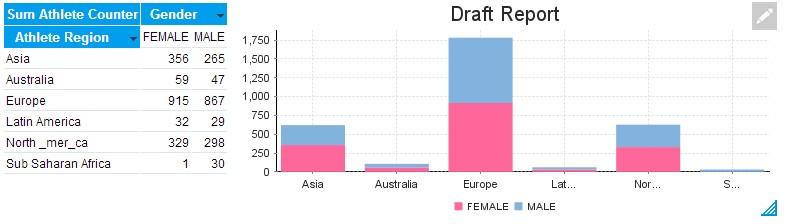
This should give you the results you are after, a stacked bar chart with different colors for each stack
Hope this helps you to achieve what you are trying to do.
Regards,
Stephen
In your case you do not need conditional formatting to format the chart.
Below is an example of a simple Crosstab Report, displaying the number of male/female athletes per region in a Stacked Bar Chart.
I first Populate the Series, and then changed the color to pink for female athletes and blue for male athletes, using the Charts Series Settings as follows:
This should give you the results you are after, a stacked bar chart with different colors for each stack
Hope this helps you to achieve what you are trying to do.
Regards,
Stephen
Thank you Stephen that's done it!