
How do I set my secondary access scale values to match my table data format?
25 October, 2014
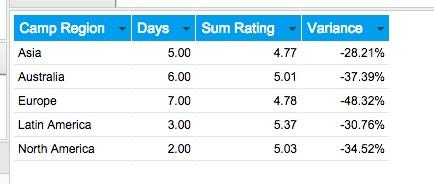
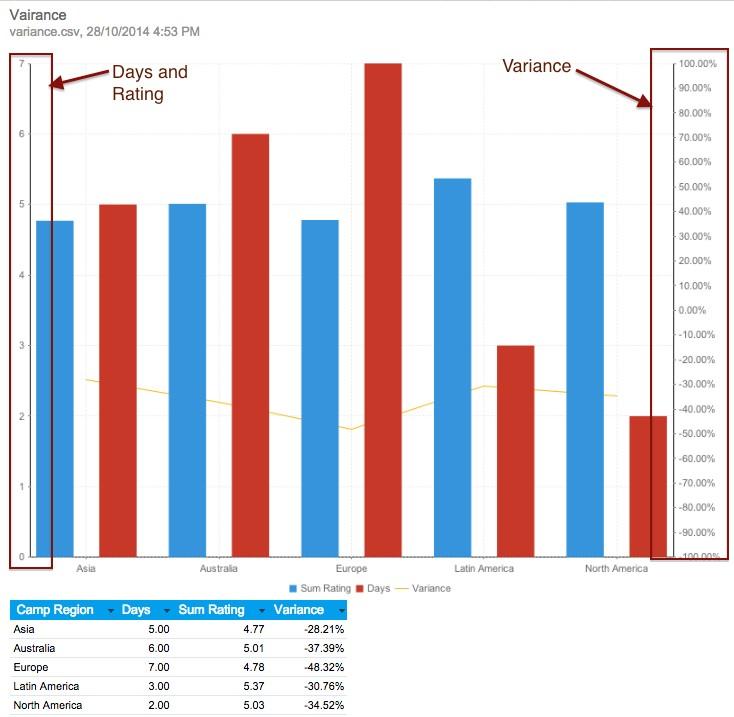
Hi. I am creating an Overlay Chart with a line representing a % Variance calculate field metric. I added a secondary axis to the chart, and would like the number format of the values displayed on this secondary axis to match the number format of the values in the corresponding column in the data table. For example, per the attached screenshot, one row value in the table is -28.21%, and the chart displays this value between -0.2% and -0.3%. Is there a way to set the secondary axis to display -20.00% and -30.00%? I've also attached the current settings of the secondary axis' Scale and Style settings. (Please note the 2 in the Secondary Dec. Places settings box is getting erased/removed as soon as I close the Axis Settings dialogue box, so if this setting is the answer, then I believe I'm experiencing a bug with this functionality.)
Hi Steve,
Thank you for contacting us on the forum and thank you for sending through the screenshots, this always helps.
I have had a look into this for you and created an example report, to hopefully provide the solution you need

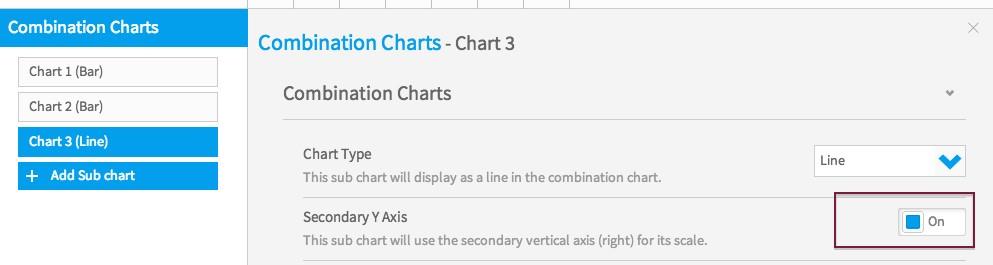
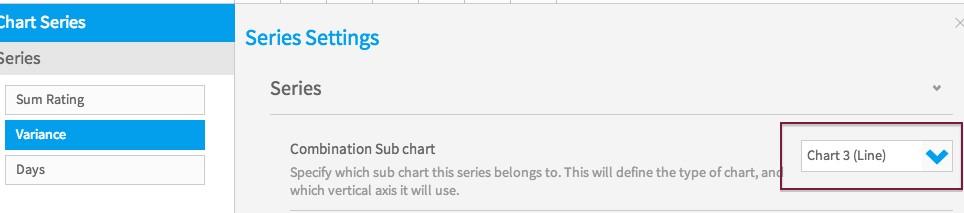
I have selected Variance to be a line and selected for this to use the secondary axis.
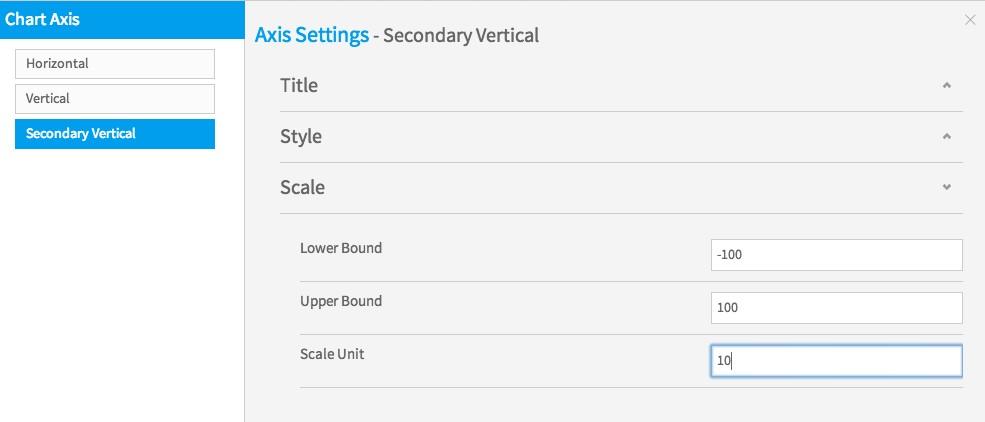
To achieve the scale you require, I set my Boundaries as the screenshot below.
Regarding the issue re the 2 decimal places being removed, I wondered if you could tell me what version and build you are using, as I am unable to replicate this.
If you have any questions or need further assistance, please let me know.
Kind regards,
Katie
Thank you for contacting us on the forum and thank you for sending through the screenshots, this always helps.
I have had a look into this for you and created an example report, to hopefully provide the solution you need
I have selected Variance to be a line and selected for this to use the secondary axis.
To achieve the scale you require, I set my Boundaries as the screenshot below.
Regarding the issue re the 2 decimal places being removed, I wondered if you could tell me what version and build you are using, as I am unable to replicate this.
If you have any questions or need further assistance, please let me know.
Kind regards,
Katie
Thanks Katie. Could you please also show a screenshot with your table and chart axis?
The system information is as follows:
Application Version: 7.1
Build: 20140923
Java Version: 1.7.0.25
Operating System: Windows Server 2012 6.2(amd64)
The system information is as follows:
Application Version: 7.1
Build: 20140923
Java Version: 1.7.0.25
Operating System: Windows Server 2012 6.2(amd64)
Hi Steve,
Thank you for the System Information.
Regarding the decimal places, when you say it disappears, is it applying it to the chart or not displaying at all?
Here is the screenshot. I hope this is what you were after.
Any further questions, please let me know.
Kind Regards,
Katie
Thank you for the System Information.
Regarding the decimal places, when you say it disappears, is it applying it to the chart or not displaying at all?
Here is the screenshot. I hope this is what you were after.
Any further questions, please let me know.
Kind Regards,
Katie
Hi Katie. You're suggested scaling above resolved this issue. Thank you for your help with this.
Hi Steve,
Thanks for the update and great to hear it is working.
If you have any other questions, just let us know.
Kind Regards,
Katie
Thanks for the update and great to hear it is working.
If you have any other questions, just let us know.
Kind Regards,
Katie
Hi Katie
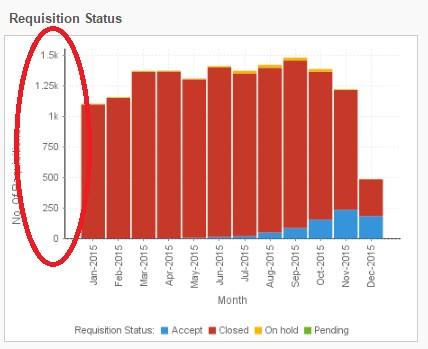
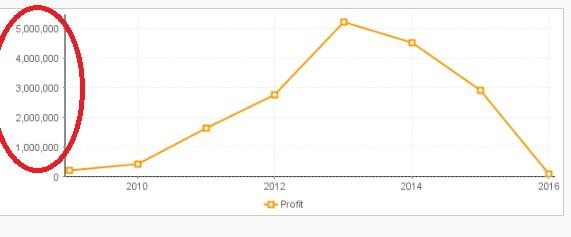
I just want to remove the scale value from a shorted from to general form like ski team report.please follow the screenshot below.
your ski team report is like this.
so i want remove that decimal point and k.
Thank You
Subha
I just want to remove the scale value from a shorted from to general form like ski team report.please follow the screenshot below.
your ski team report is like this.
so i want remove that decimal point and k.
Thank You
Subha
Hello Subha,
I believe you submitted this as a case as well via our email support channel? I believe the reason you are not seeing the option
to format your axis is because you are using the Auto-Chart functionality. If you select the chart builder you should the have the option to format your metrics to exclude decimal points and prefixes, etc.
Please let me know if you have any questions or concerns regarding this.
Thank you,
Kyle