
How to compare the value of same month in different year
21 September, 2015
Hey
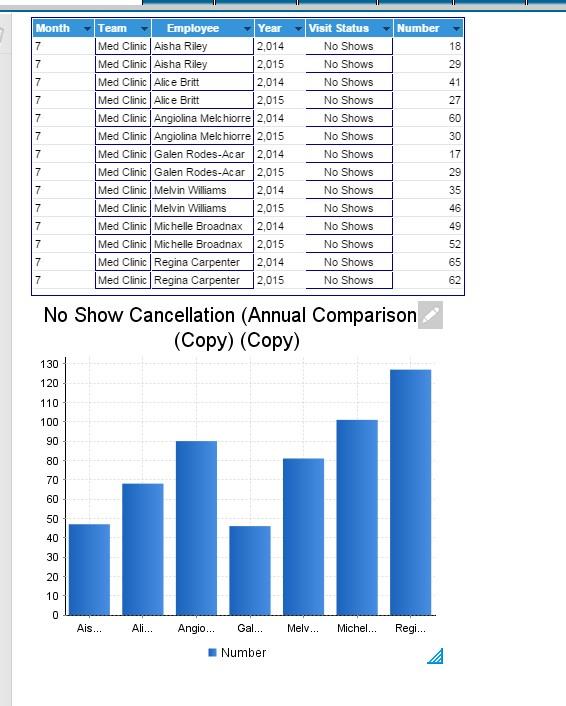
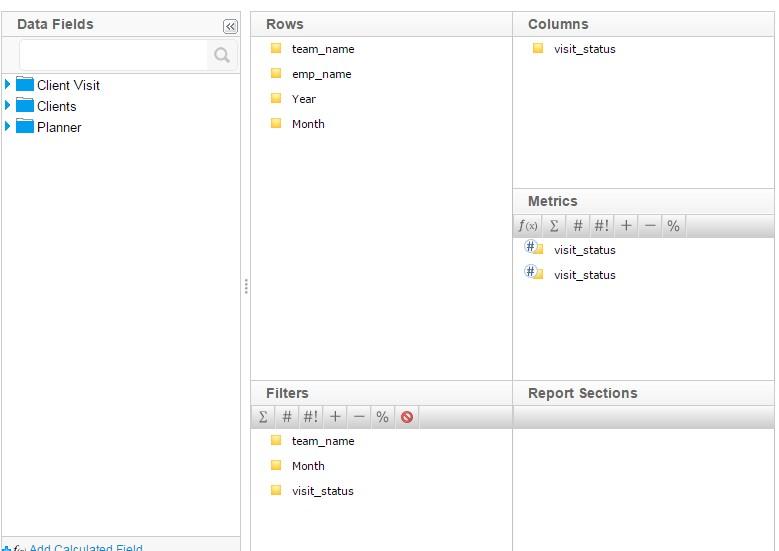
I was trying compare the number of no shows for each employee in July 2014 and July 2015 using column graph. So for each bar graph, I need two bars for each employee, one is for July 2014 and the other for July 2015. I searched yellowfin wiki and saw what time series can do. But I don't want a line graph here.
Here is the result I got.
I will be very grateful for you reply!
Hi Guest,
Thanks for the question.
It's a bit difficult to tell exactly how your report is configured from just the screenshot, but have you considered using sub queries to accomplish this? This is typically what sub-queries are used for as they allow you to break apart a set of data into two sets.
In your example you should be able to produce the number of 'no shows' for 2014 and for 2015 respectively, and then you could easily compare that data in a column chart.
Here is a link on our wiki explaining how to accomplish this (I recommend watching the video):
Append Sub Query
Hopefully this information has been helpful. Please let us know if have any questions or concerns. Have a great day!
Kind Regards,
Dustin
Hi Dustin,
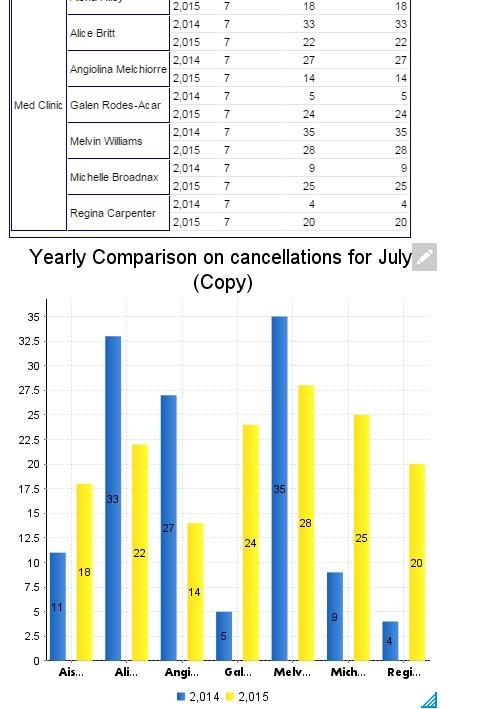
Thanks for your help. I ended up solving the problem using cross tab.

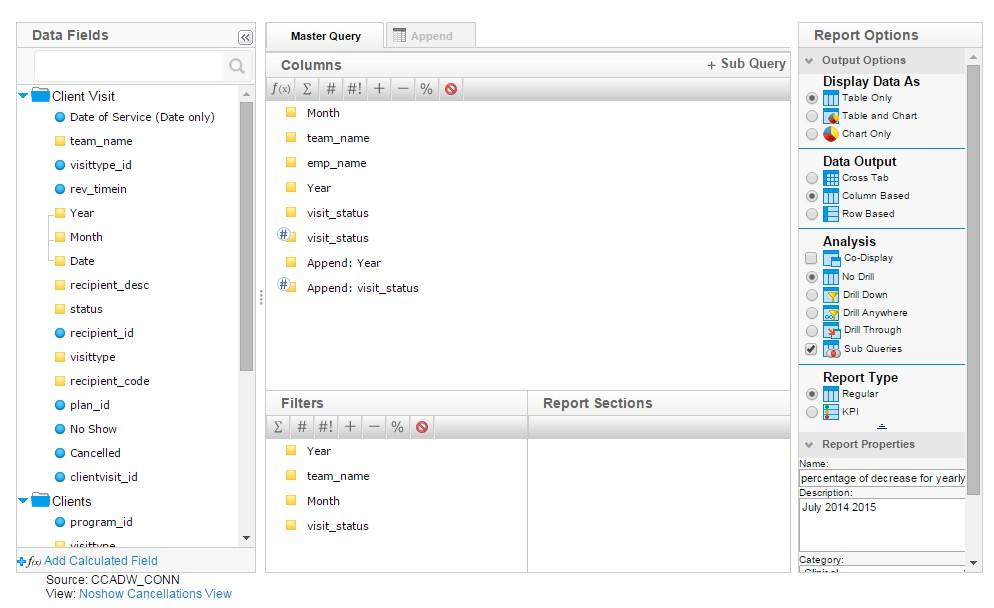
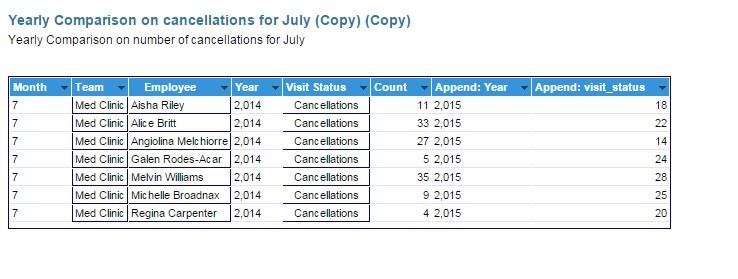
A new problem just came out: I need to see the percentage of decrease of the number of no show in 2014.07 to 2015.07. I tried append sub query here (show in the image). But I don't know how to do the percentage.
I will appreciate!
Thanks for your help. I ended up solving the problem using cross tab.
A new problem just came out: I need to see the percentage of decrease of the number of no show in 2014.07 to 2015.07. I tried append sub query here (show in the image). But I don't know how to do the percentage.
I will appreciate!
Hi Guest,
I'm glad to hear that you were able to get your chart to appear correctly.
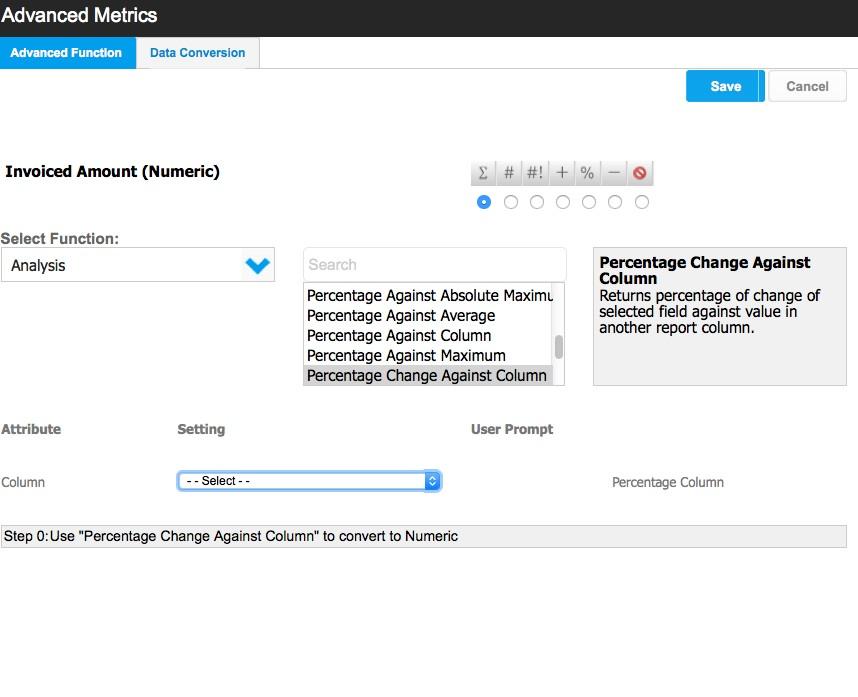
Regarding calculating the percentage, I think what you are looking for is the 'Percentage Change Against Column' advanced function.
This function allows you to compare two columns, and return the percentage of change between the two.
To accomplish this:
1. Drag in a second 'count' column into your master query
2. Apply an advanced function as mentioned in the above wiki article
3. Select the 'Percentage Change Against Column' advanced function (found underneath the analysis drop down)
4. Select the 'Append: view status' column and save the advanced function
5. Notice that a percentage of change between 'Count' and 'Append: view status' has been applied
Hopefully this information has been helpful. Please let me know if you run into any troubles. I look forward to hearing how it goes.
Kind Regards,
Dustin
I'm glad to hear that you were able to get your chart to appear correctly.
Regarding calculating the percentage, I think what you are looking for is the 'Percentage Change Against Column' advanced function.
This function allows you to compare two columns, and return the percentage of change between the two.
To accomplish this:
1. Drag in a second 'count' column into your master query
2. Apply an advanced function as mentioned in the above wiki article
3. Select the 'Percentage Change Against Column' advanced function (found underneath the analysis drop down)
4. Select the 'Append: view status' column and save the advanced function
5. Notice that a percentage of change between 'Count' and 'Append: view status' has been applied
Hopefully this information has been helpful. Please let me know if you run into any troubles. I look forward to hearing how it goes.
Kind Regards,
Dustin
Hi Dustin,
Thanks for the fast response. I'm very grateful.
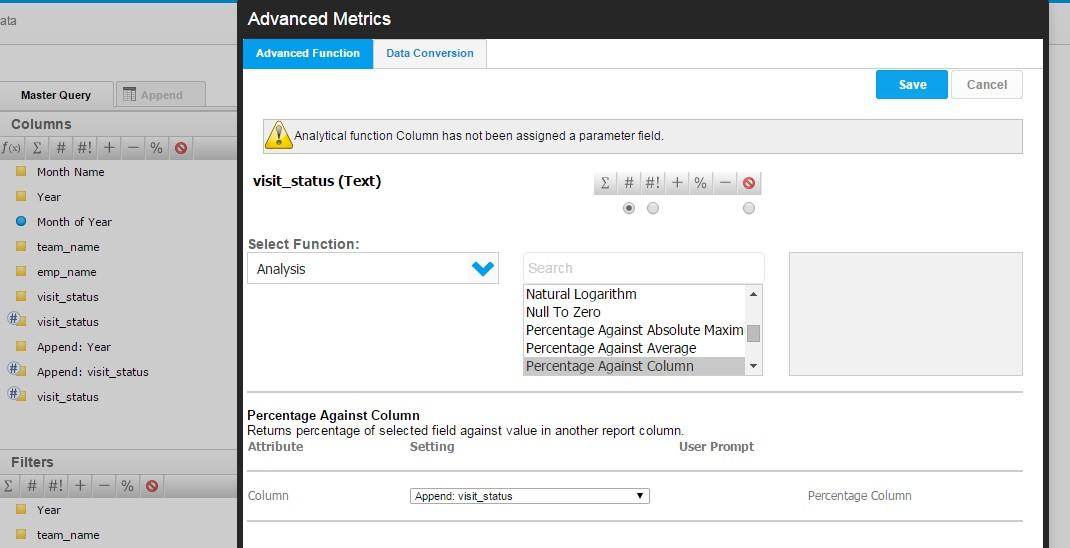
Date, Month and year are in the same time hierarchy. I tried your way but not sure how to apply count before I apply the advanced function percentage against column (see the image below). Seems that only one function can be applied? Therefore, it reported error and didn't give me any result.
Thanks a lot again!
Thanks for the fast response. I'm very grateful.
Date, Month and year are in the same time hierarchy. I tried your way but not sure how to apply count before I apply the advanced function percentage against column (see the image below). Seems that only one function can be applied? Therefore, it reported error and didn't give me any result.
Thanks a lot again!
Hi Guest,
Apologies for the delayed response!
I didn't realize that your column was aggregated prior to trying to apply the advanced function. This does complicate things a tad.
I think you might have to consider using view level calculated fields to calculate the count of visits before building your report. This is necessary because report level calculated fields cannot be referenced in an append sub query.
Then you could use the 'Percentage against Column' or 'Percentage Change Against Column' advanced functions to calculated the % difference. Let us know if this will work for you.
We look forward to hearing how it goes.
Kind Regards,
Dustin