
How to put Side by Side charts in single report with co-display
18 December, 2014
Hello,
In Yellowfin 6.3, how to put side by side charts in a single report itself.
Through we are having a option in Report builder with co-display , in which step 3 Co-display option,co-display right, co-display top, co-display bottom and all.
If i select co-display top,inside that putting 3 charts
then saving that report, it will come one below the other.
then main report will be in bottom.
it has enough of space in top.
Please guide me to how to put side by side charts in a single report itself
Thanks,
Thara
Hello Thara,
Thank you for posting your question / issue on the forum.
Can you please tell us which build of 6.3 you are currently
using? E.g. Nov?
Also, is it possible for you to send in a few screenshots
showing us your steps and what you've got so far?
If you need to send those via email you can send them
to support@yellowfin.bi and reference this post.
I was able to get charts side by side in a single report but
it sounds like you are dealing with more then 2 charts in
your report.
Thank you,
Kyle
Hello Kyle,
Thank you for your response.
Exactly the requirement is the same.
ours is 6.3, last year version 2013.
I am unable to find Multi chart function check box in the report builder.
only 3 options
table only
table and chart
chart only.
i am having a report like 4 attributes and 8 measures
in which i suppose to create chart for each attributes with 2 measures with various charts,
so it will be like 1 report with multiple charts.
So requirement is all these charts are created individually but only one report should hold all these charts with side by side.
Is it possible to create in multi charts in a single report and placing side by side
along with table, charts.
.
Thanks,
Thara
Hi Thara,
I think the only way you are going to get what
you are after is to use the Tabbed section in
the related reports section of the report builder.
This should allow you to get your charts side by
side with a report and then do the same with
your other reports.
I've also included a link to our Wiki regarding
co-display reports.
Co-Display
Please let us know how this goes.
Thank you,
Kyle
Hello Kyle,
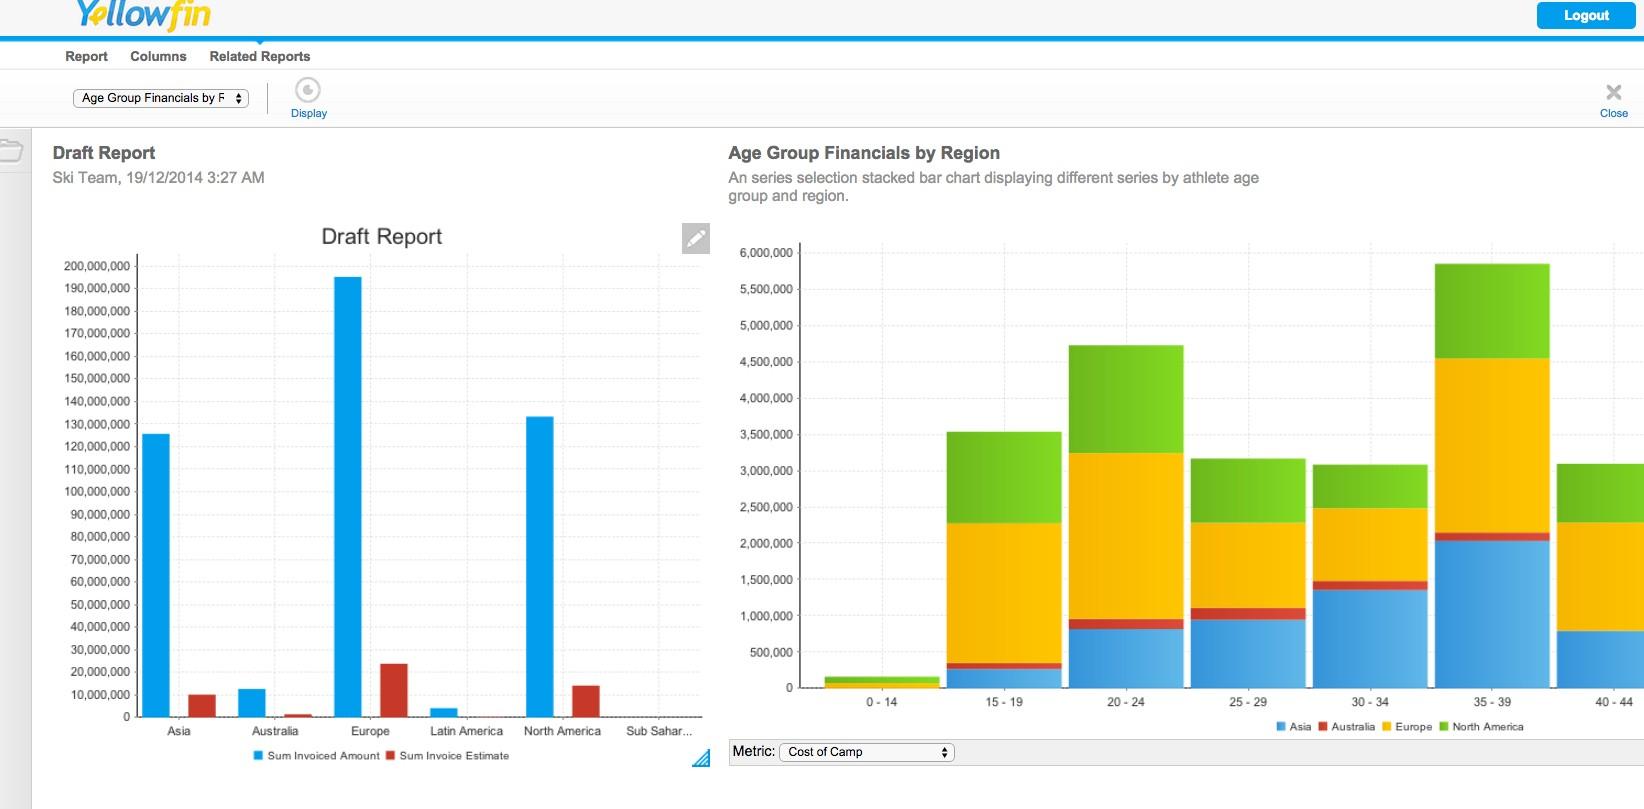
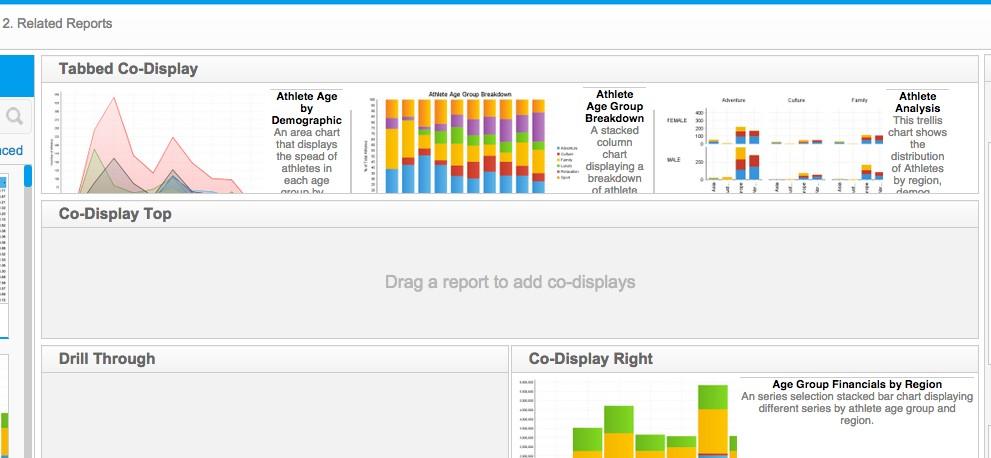
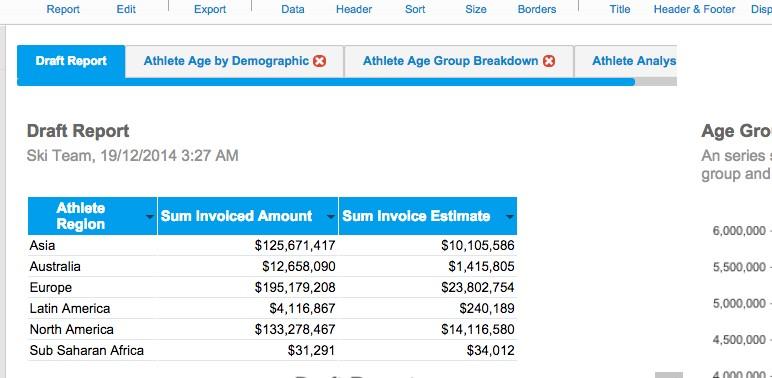
I enclosed the screen shot.
The main Report is having Table With corresponding details,
Filter option is set and it is minimized in Left side..
Respective individual charts has been created using "TESTING_FIELDS2" report.
and those 3 charts
TESTING_FIELDS3,
TESTING_FIELDS4,
TESTING_FIELDS5
are called in Co-display tab of main report TESTING_FIELDS2 by setting Filter condition.
Is it possible to display all the 3 charts side by side in same page along with table such that it should display as
TESTING_FIELDS2
table, data
TESTING_FIELDS3 TESTING_FIELDS4 TESTING_FIELDS5
One more query is is it possible to create all these 3 charts along with table in one report itself?
Such that the screen should look like
TESTING_FIELDS2
table, data
Below this data all 3 graph should come..
TESTING_FIELDS3 TESTING_FIELDS4 TESTING_FIELDS5
Please suggest.
Thanks,
Thara
Hello Thara,
Unfortunately you won't be able to get the 3 graphs / charts
laid out side by side by side in a report. That configuration is not
an option.
One of the graphs would need to be under the other two.
Sorry for the bad news.
Please let me know if I have misunderstood your question
or if there is anything else that you need.
Thank you.
Kyle
Hello Kyle,
Thanks for your response and clarification.
Hope You did not misunderstand the question.
The requirement is like charts/graphs putting side by side inside a single report itself.
as per this..... configuration is not made or this configuration is not in an option.
I am searching for that option only,
So please guide me is there any other alternative method such that in one report itself create multi charts with various dimensions.
Such that one report should look like a one dashboard.
all information has to available in single report itself... with different graphs..
Thanks,
Thara
Hello Thara,
Other then upgrading to a newer version of YF (E.g. 7.0 or 7.1)
there is really not a work around or an alternative to satisfy
your exact requirement.
The two newer versions of YF have the Multi-Chart functionality.
Multi-Charts
Again, sorry for the bad news.
Thank you,
Kyle
Other then upgrading to a newer version of YF (E.g. 7.0 or 7.1)
there is really not a work around or an alternative to satisfy
your exact requirement.
The two newer versions of YF have the Multi-Chart functionality.
Multi-Charts
Again, sorry for the bad news.
Thank you,
Kyle