
How to set the custom color setting for PieChar, BarChart…Etc…?
6 March, 2014
How to set the custom color setting for PieChar, BarChart...Etc...?
Hi,
To set the default colors used in your charts, you can set the default Color Palette in Content Settings.
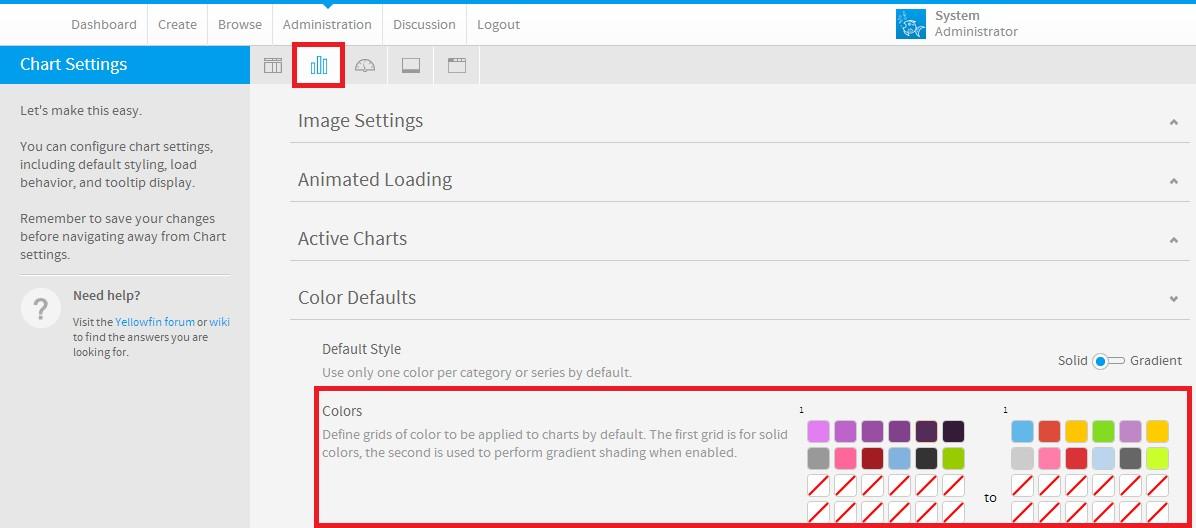
This will automatically change the colors used in your Charts.
Please let me know if this is what you were after.
Regards,
Stephen
To set the default colors used in your charts, you can set the default Color Palette in Content Settings.
This will automatically change the colors used in your Charts.
Please let me know if this is what you were after.
Regards,
Stephen
Hi Stephen,
Thanks for your response.
The solution what you provided is default color setting for all kind of charts.
My requirement is,
1) For example, I am having a PieChart which is divided by two parts. I need to set the desired color for each part. How can I set this?
2) For BarChart, I am having five different type of queries. Each query will return some set of data. I combined these queries using UNION.
I like to set different color for each bar in chart.
3) Also the default color setting is common for BarChart, PieChart and all. How to avoid this. For BarChart --> different settings.. For PieChart --> different settings.
Please suggest the best way to do this.
Hi Chandra,
Apologies I must have misunderstood the initial requirement
What you are trying to achieve is possible with the use of Conditional Formatting.
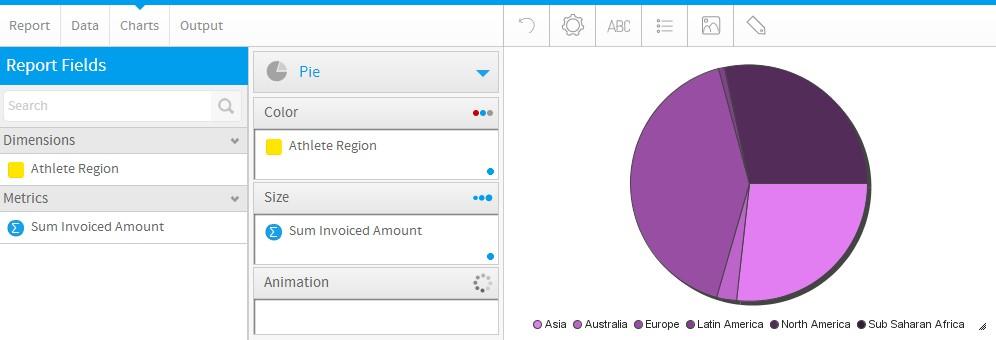
1) Pie Chart
Conditional Formatting has to be applied to the Dimension as previewed below

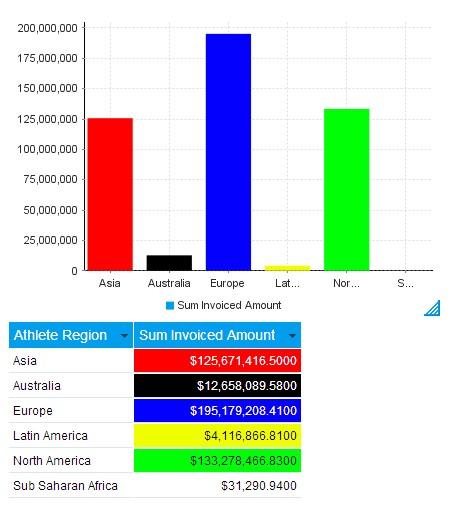
2) Bar Chart
Conditional Formatting has to be applied to the Metric as previewed below
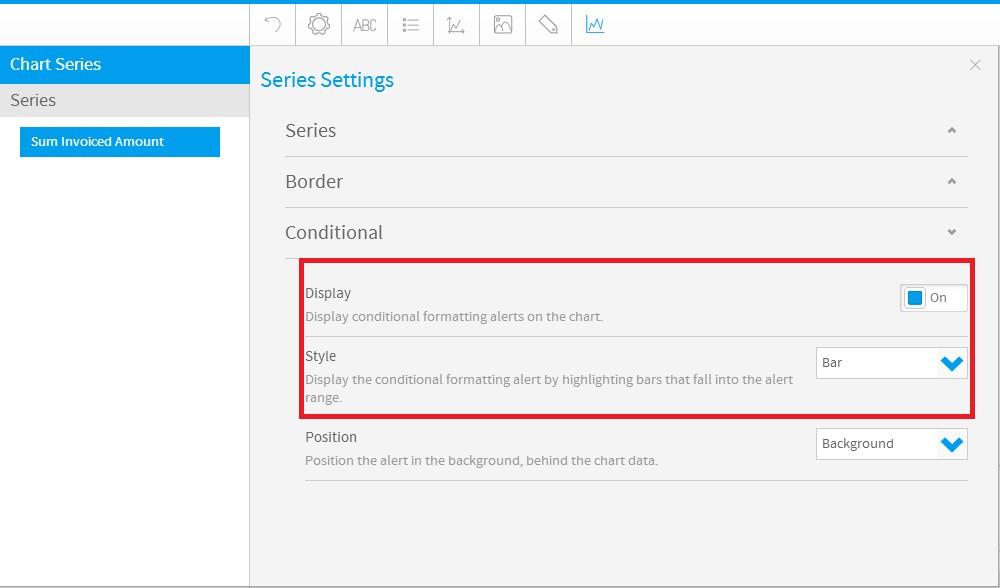
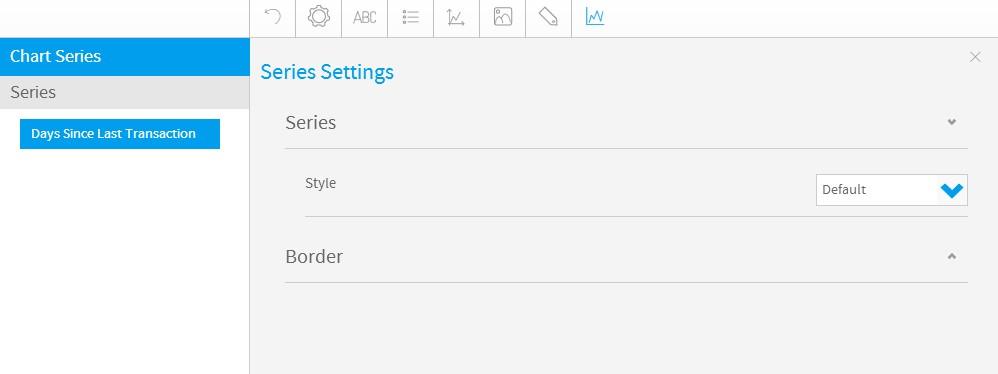
You also have to enable the display of Conditional Formatting in the Chart's Series Settings.
3) Unfortunately there is no default Color Palette for every single chart.
Hope this helps you to achieve what you trying to do
Regards,
Stephen
Apologies I must have misunderstood the initial requirement
What you are trying to achieve is possible with the use of Conditional Formatting.
1) Pie Chart
Conditional Formatting has to be applied to the Dimension as previewed below
2) Bar Chart
Conditional Formatting has to be applied to the Metric as previewed below
You also have to enable the display of Conditional Formatting in the Chart's Series Settings.
3) Unfortunately there is no default Color Palette for every single chart.
Hope this helps you to achieve what you trying to do
Regards,
Stephen
Hi Stephen
I have followed all the above (setting up conditional formatting) and have been successful in getting the conditional formatting to show in the table for either the dimension or the metric.
However, I cannot get the formatting to apply to the chart.
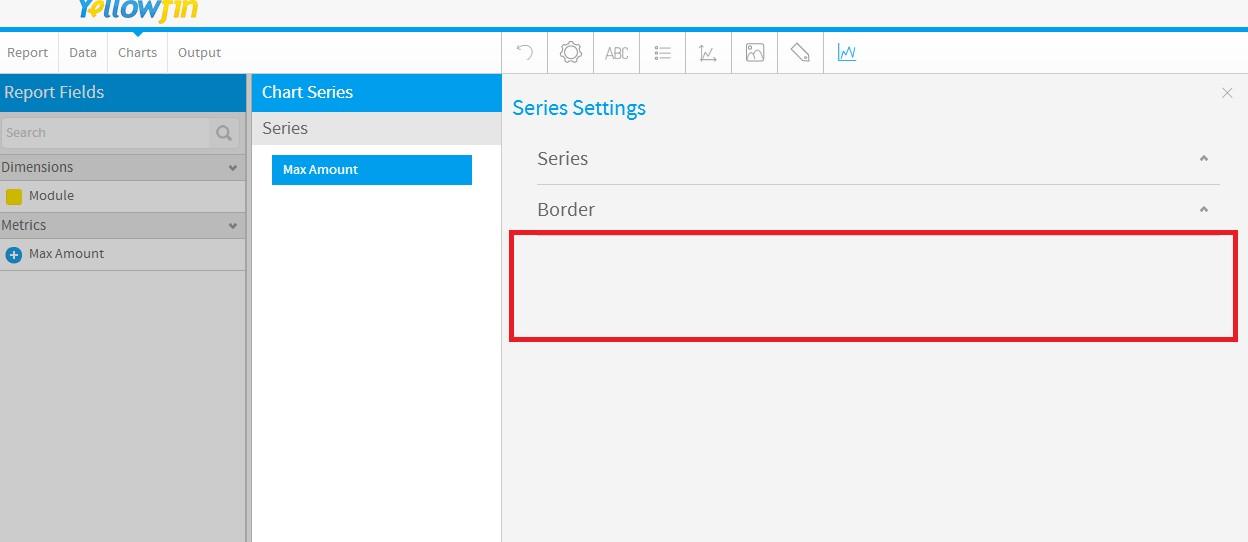
There is no setting to turn on conditional formatting in Chart Series Settings.
I have followed all the above (setting up conditional formatting) and have been successful in getting the conditional formatting to show in the table for either the dimension or the metric.
However, I cannot get the formatting to apply to the chart.
There is no setting to turn on conditional formatting in Chart Series Settings.
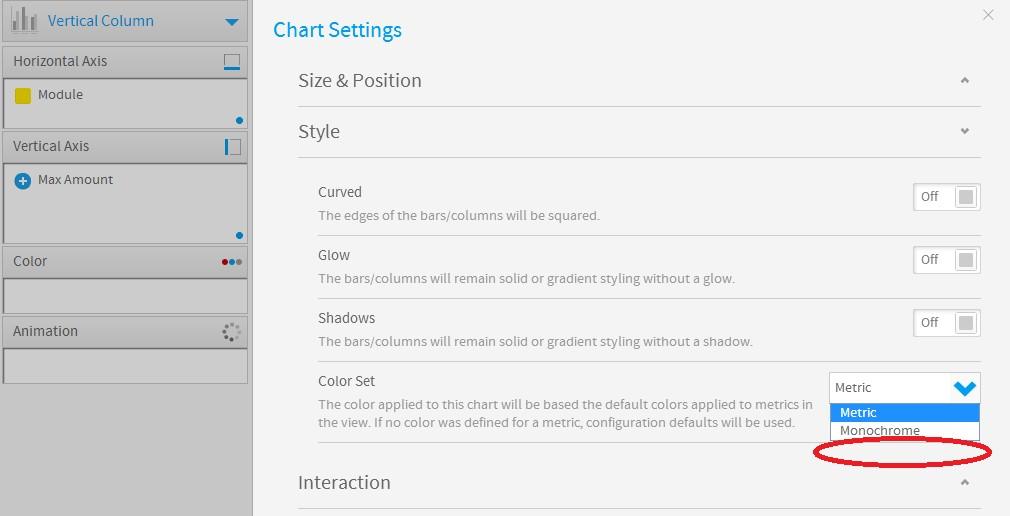
Just noticed there is also no ability to set Color Set for bar charts
Hi Samuel,
Different charts support different display options.
E.g. You can set a conditional form for a dimenionsion, and then have it display on a pie chart. As the chart will actually display the dimension.
However when using a bar chart, the metric is displayed, so the conditional format will need to apply to the metric.
The chart 'conditional' option is only found under the 'series settings'
Keep in mind, it will only bring in the metric, so you then show the conditional format on the bar, but on related to the metric.
Hope this covers everything.
Regards,
David
Hi Dave- That makes sense.
So I'm almost there...
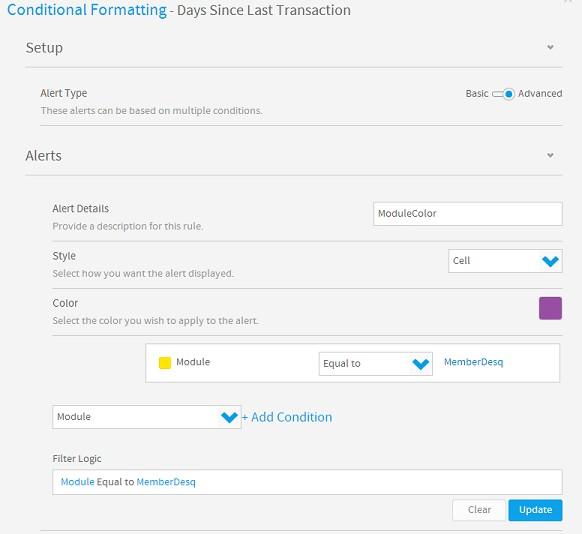
Conditional format is setup for the metric, based on the dimension value.
(In this case, 'hightlight purple when Module = MemberDesq')
Conditional formatting is showing up on the table, but cannot get it to show up on the chart.
Can't seem to find 'Conditional' option under Series settings to turn that option on.
Am I missing something else??
So I'm almost there...
Conditional format is setup for the metric, based on the dimension value.
(In this case, 'hightlight purple when Module = MemberDesq')
Conditional formatting is showing up on the table, but cannot get it to show up on the chart.
Can't seem to find 'Conditional' option under Series settings to turn that option on.
Am I missing something else??
Hi Samuel,
The Conditional menu option, is NOT available when using Advanced Conditional Formatting.
It is only available when using Basic Conditional Formatting.
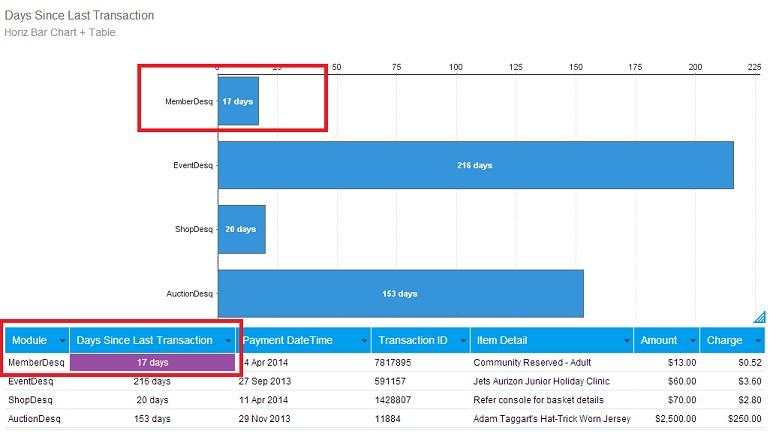
(e.g. 'hightlight purple when Days = 17')
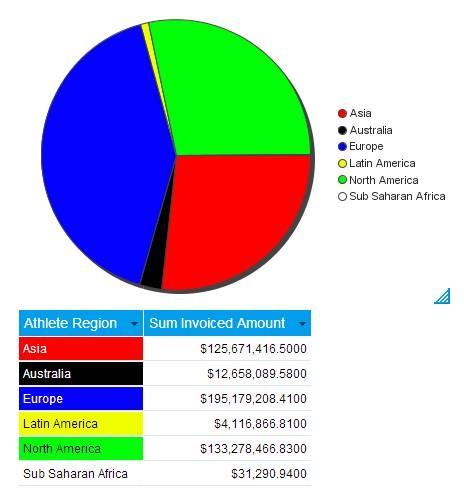
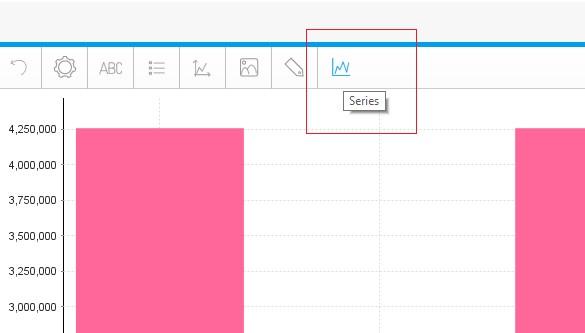
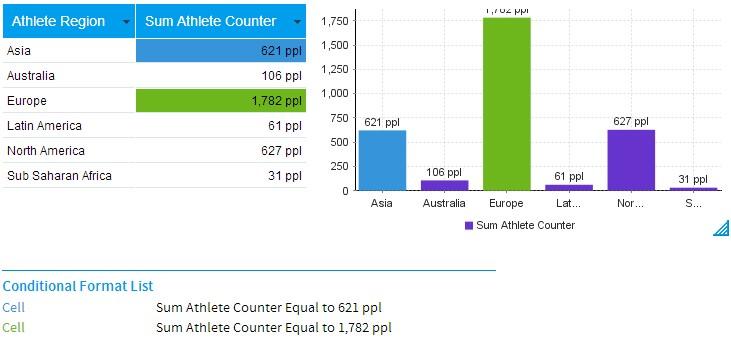
Chart with Basic Conditional Formatting applied
There is an existing dev task (TASK # 105261) for this feature to be made available for Advanced Conditional Formatting as well.
Apologies for the inconvenience cause and I hope this explains what you are trying to achieve.
Regards,
Stephen
The Conditional menu option, is NOT available when using Advanced Conditional Formatting.
It is only available when using Basic Conditional Formatting.
(e.g. 'hightlight purple when Days = 17')
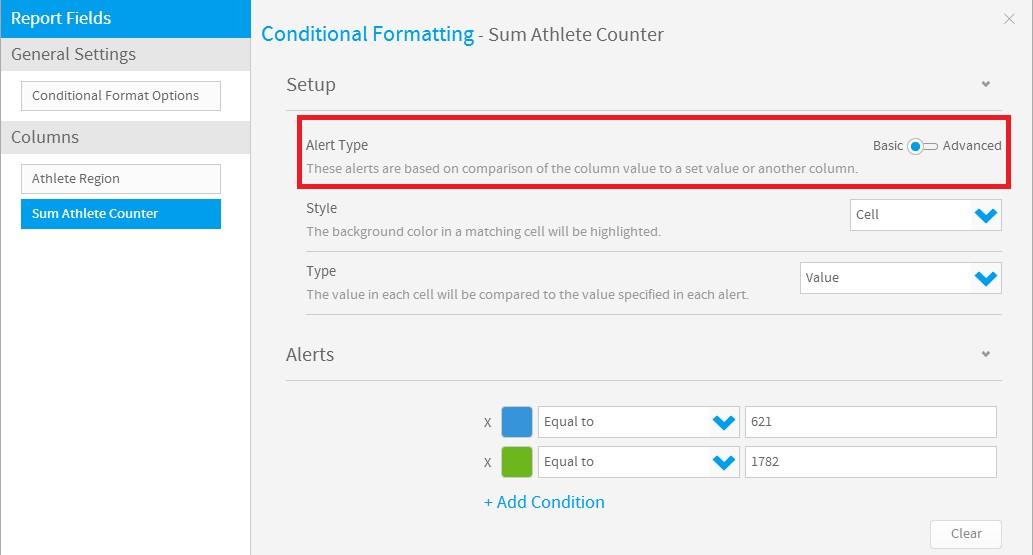
Chart with Basic Conditional Formatting applied
There is an existing dev task (TASK # 105261) for this feature to be made available for Advanced Conditional Formatting as well.
Apologies for the inconvenience cause and I hope this explains what you are trying to achieve.
Regards,
Stephen
Hello. Has dev TASK # 105261 made it into the Yellowfin 7.2 coming out next month?
Hi Peter,
Hope you are well,
I have just tested in 7.2 and unfortunately this feature has not made it in to the 7.2 release. I will update the request stating you are chasing this.
As soon as we have an update we will be able to update this post. if you do have any further questions please feel free to contact us.
Thanks
Adam